Regarding the post-FOMC “noise”, so far we the first full trading day (Thursday) was bullish with the Friday & so far today the stock market (S&P 500) giving back half (a 50% Fibonacci retracement) of the post-2pm FOMC rally. A full fade (100% retracement) of the post-announcement rally would be quite bearish IMO & we are now at the point where that post-FOMC “noise” should begin to abate, with the stock market likely to start telling us what the direction of the next tradable trend will be. Keep in mind this is a 4-day trading week with the US stock market closed for Good Friday.
IEF (7-10 yr Treasury bond ETF) remains in the yellow zone after being rejected off the top of it (94.50 resistance as well as a new potential downtrend line) while coming up on the 94ish support. A solid break above the yellow zone would likely be net bullish for the stock market with a drop down into the orange zone bearish for equities. 60-minute chart below.
One of the other major asset classes that I continue to monitor for clues on where equities are likely headed from here is crude oil. USO/crude oil ETN (i.e.: inflation) remains solidly entrenched in a near-term uptrend with a solid break above 70 to put it in my orange zone (bearish for equities) while a drop back below the yellow zone & especially below that likely to be net bullish for stocks. Daily chart below.
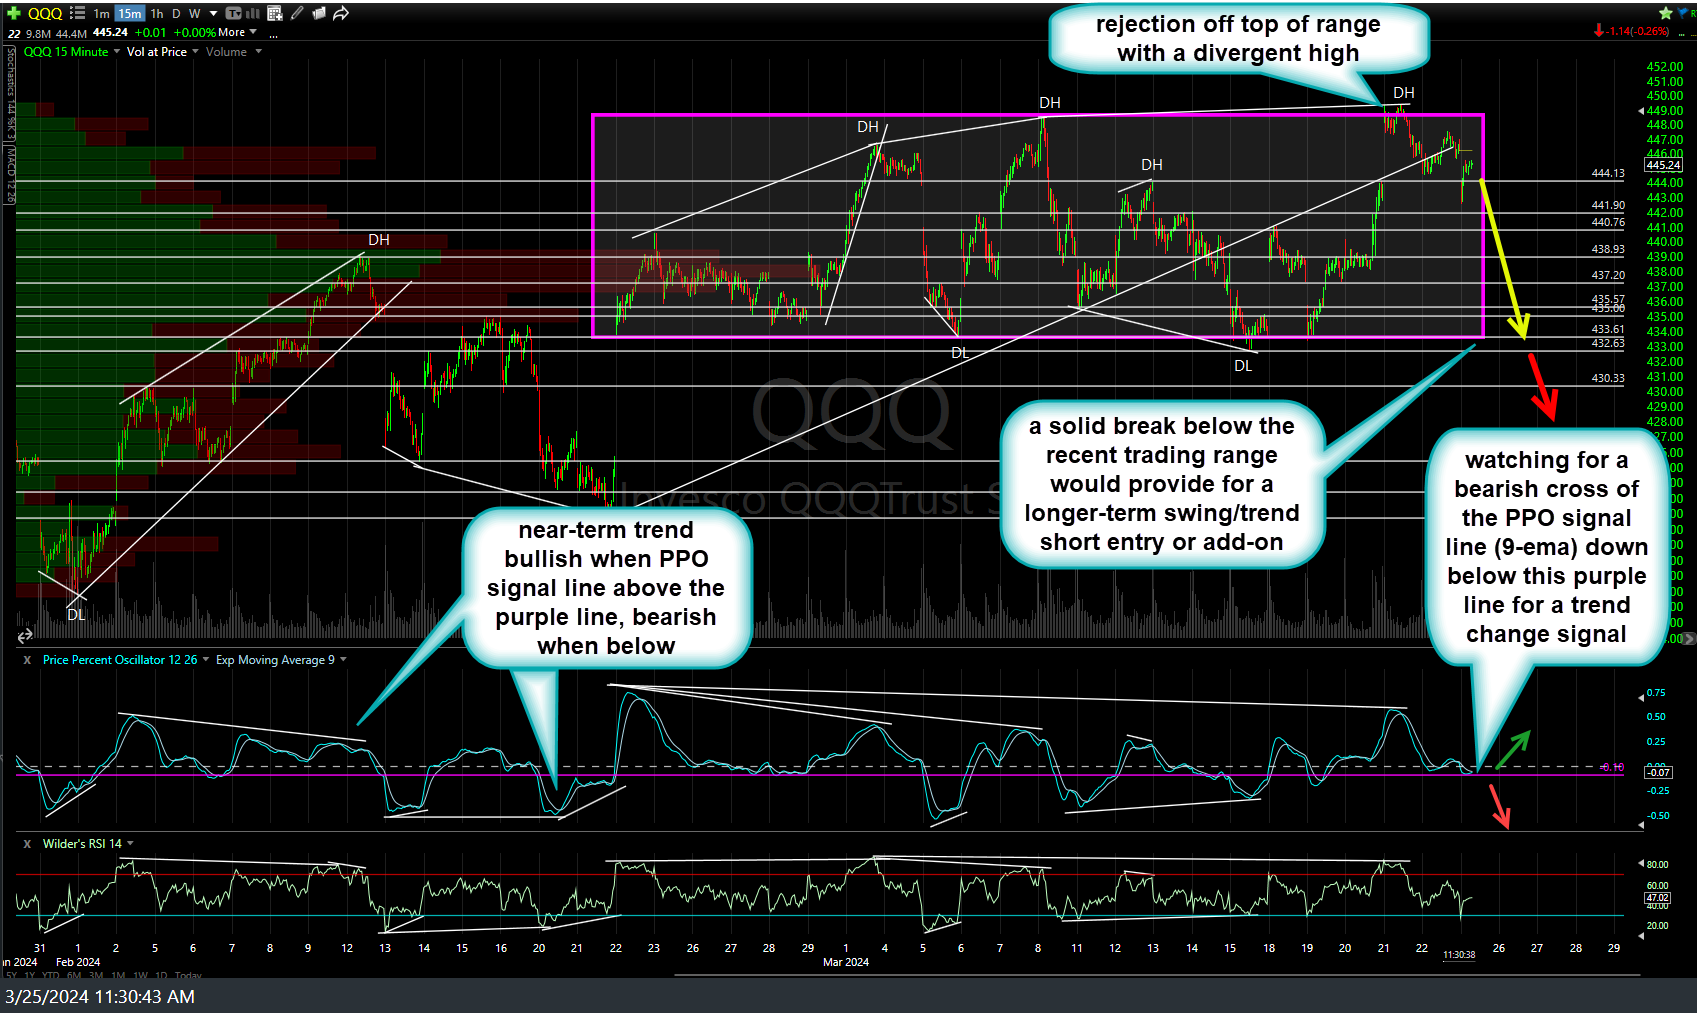
Here’s the updated 15-minute chart which the most recent active trader + potential swing trade short was entered at Thursday’s high (top of trading range). The PPO is currently testing the -0.10 bull/bear trend delineation line from above, keeping that particular trend indicator on a buy signal for now although a solid cross of the PPO signal line (9-ema) below it would signal a near-term (bearish) trend change. I would seem prudent to lower stops to around the top of the range/Thursday’s highs at this time for those short while those bullish & might want to see the top of the range solidly taken out and/or wait to buy pullbacks to any or all of the support levels on this chart down to but not below the bottom of the trading range (purple box).


