Several times in recent years, including shortly before the 14%+ correction in the Nasdaq 100 in September, I’ve posted one of my indicators used to help predict corrections. This indicator is beyond simple although as with many indicators; A) It is not an exact timing indicator and B) It is best used in conjunction with other sell signals, such as a solid break of a well-defined support level following a divergent high.
The indicator is a 10-day exponential moving average that I plot over the daily volume on the major stock indices. When the 10-day volume EMA falls to or below a certain level (I have charts with both a single line as well as these with two lines; red & yellow), a correction usually soon follows. On the daily chart of SPY below, we have the first drop to the low-volume sell signal lines, both red & yellow, since just before the 11%+ correction in the S&P 500 kicked off back in early September.
Likewise, we also have the first drop to the low-volume sell signal lines (both red & yellow) since just before the 14% correction in early September on QQQ.
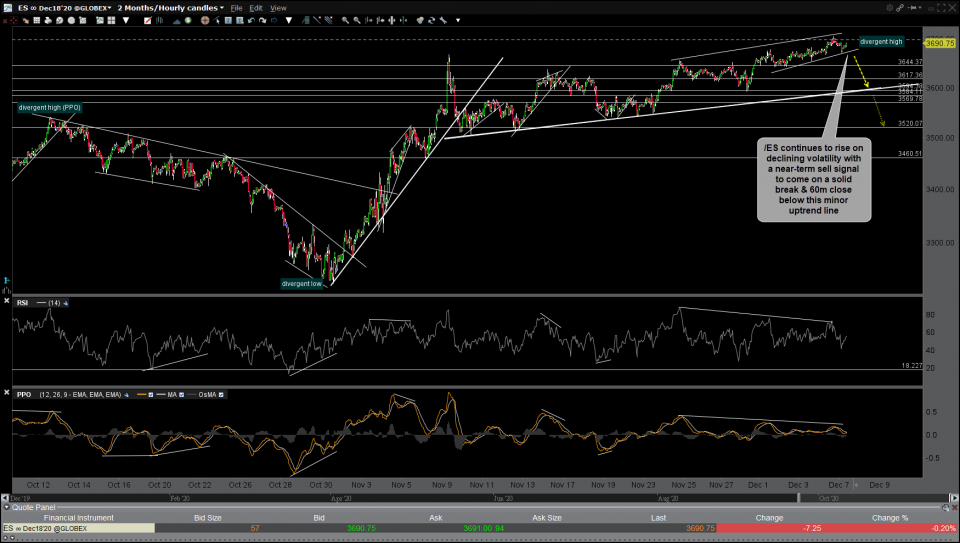
Once again, my low-volume indicator is not an exact timing indicator, meaning that you don’t exit your longs or go short on the first drop to the yellow or red lines. Rather, it shows us one particular development going on under the hood (i.e.- the stock market rising on diminishing volume, or stocks rising with fewer & fewer buyers as short-sellers start to give up, hence, less volume there as well). Regarding the timing of a correction, we could get some potential early sell signals on breaks below these 60-minute uptrend lines on /ES & /NQ (S&P 500 & Nasdaq 100 E-mini futures) although solid sell signals on the daily timeframes would increase the odds of any swing short positions playing out. As of now, the trend remains bullish without any sell signals.


