SPY (S&P 500 Large-Cap Index ETF) is trading at the top of the multi-week trading range just shy of the key June 11th gap (resistance).
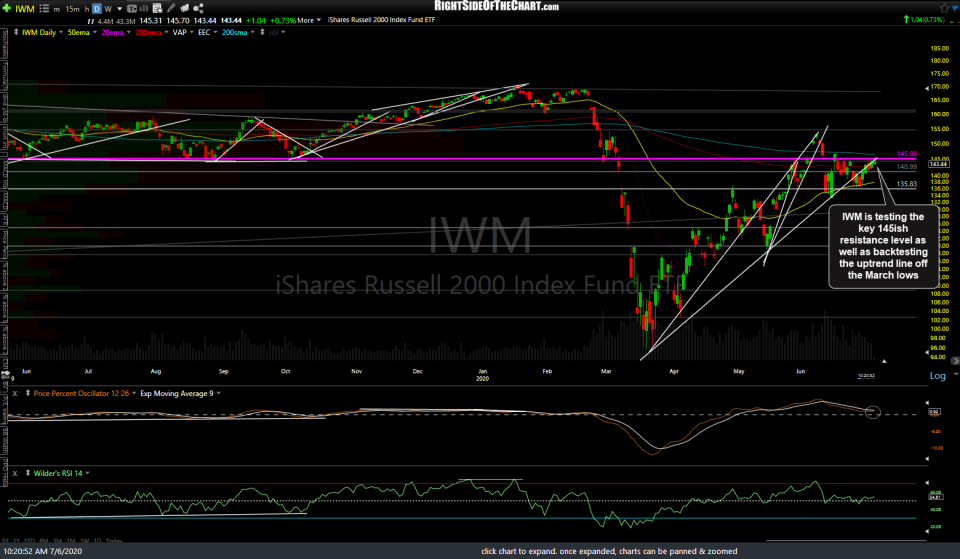
IWM (Russell 2000 Small-Cap Index ETF) is testing the key 145ish resistance level as well as backtesting the uptrend line off the March lows.
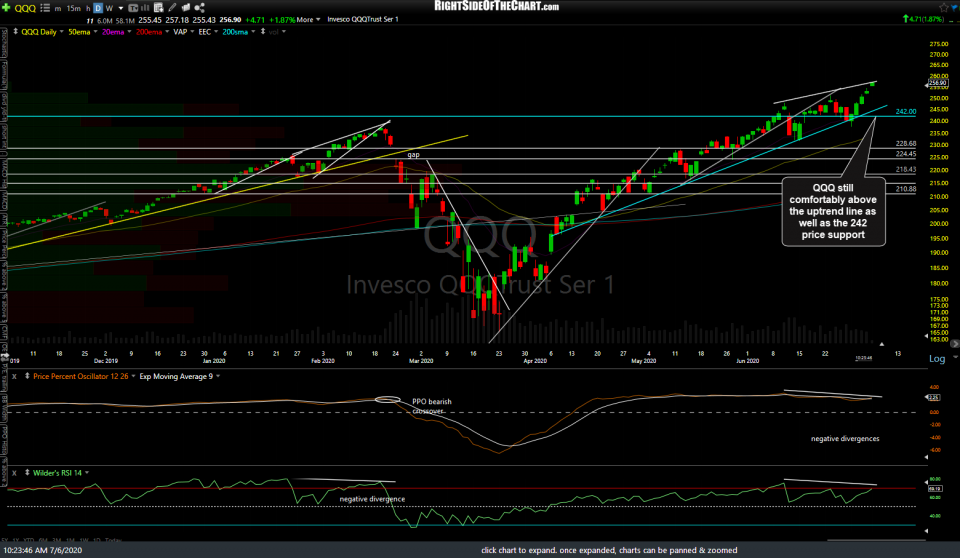
QQQ (Nasdaq 100 Index ETF) remains comfortably above the uptrend line as well as the 242 price support with a sell signal still pending a solid break and/or close below both.
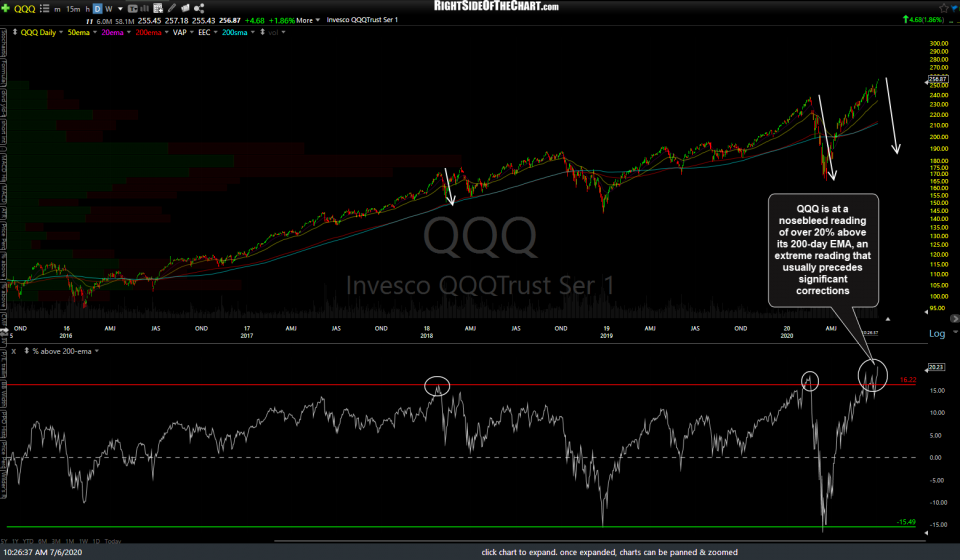
QQQ is also at a nosebleed reading of over 20% above its 200-day EMA, an extreme reading that usually precedes significant corrections.
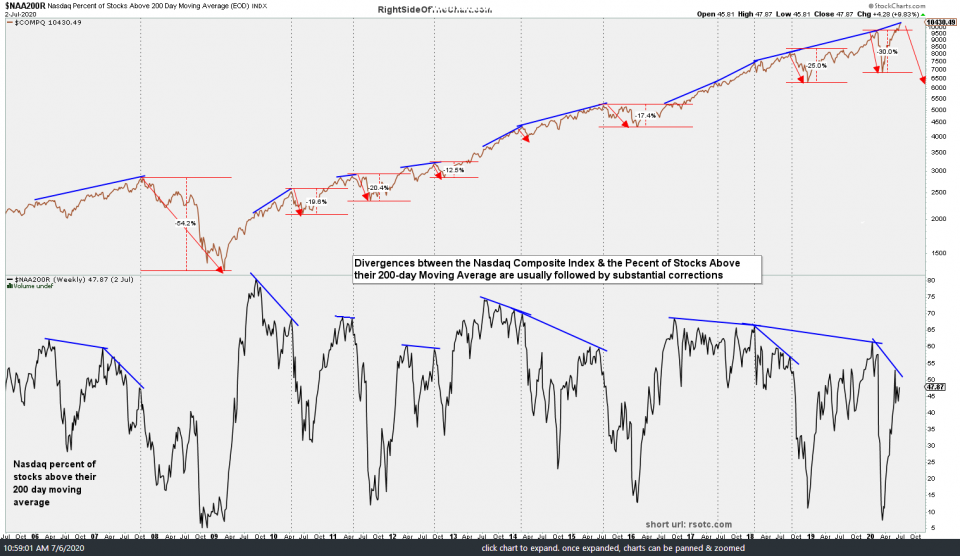
Not to be confused with the previous chart, which shows the percentage that QQQ is currently trading above or below its 200-day exponential moving average (essentially a measure of how overbought or oversold the index is), the chart below shows the divergences between the Nasdaq Composite Index and the percent of stocks within the Nasdaq Composite which are trading above or below their 200-day moving average. In other words, this a breadth indicator that tells us that fewer & fewer stocks within the Nasdaq are rising along with the index. i.e.- The overweighted market-leading FAAMG stocks continue to do most of the heavy lifting.
The fact that the tech & FAAMG-heavy Nasdaq 100 & Nasdaq Composite Indexes are trading at all-time highs while every other index (S&P 500, Dow 30, Mid-Caps, Small-caps, etc..) are still trading well below their all-time highs is also a form of divergence (Nasdaq making higher highs with all other indices at lower highs). The story remains the same: Until tech & the FAAMGs break, the market will continue to hold up. Historically, the more pronounced this deterioration in market internals (breadth) & the longer it continues, the more powerful the ensuing trend reversal once it finally sets in. With the Nasdaq 100 comfortable above those key support levels, for now, my focus this week will be how SPY & IWM handles those key resistance levels just above.


