In lieu of an end-of-session video, I figured that I’d just post a few charts as the major stock indexes closed around the same levels they were trading at when I had to leave my desk after the mid-session video posted earlier today.
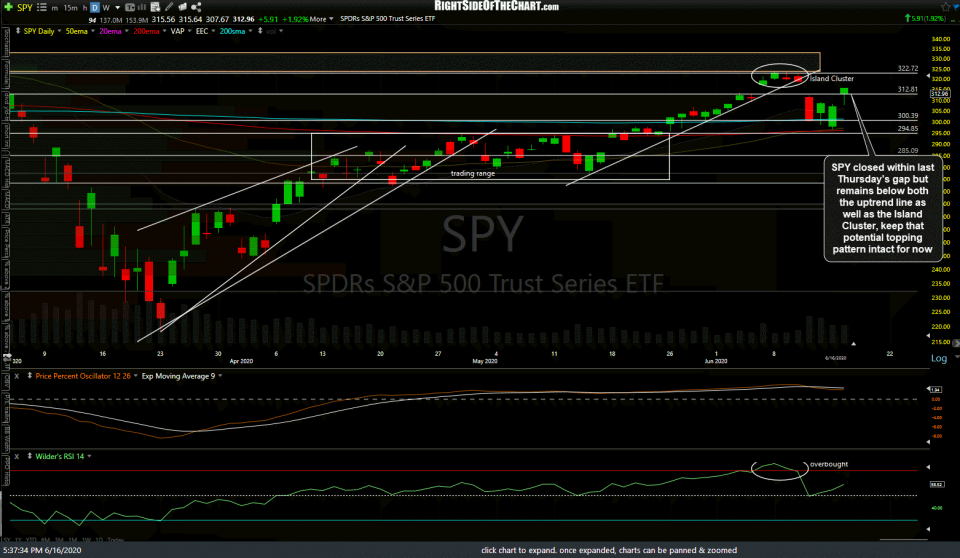
SPY closed within last Thursday’s gap but remains below both the uptrend line as well as the recent cluster of candlesticks, keeping the potential Island Cluster topping pattern intact for now. Any move much above the island would invalidate that pattern, potentially opening the door for a test of the previous highs.
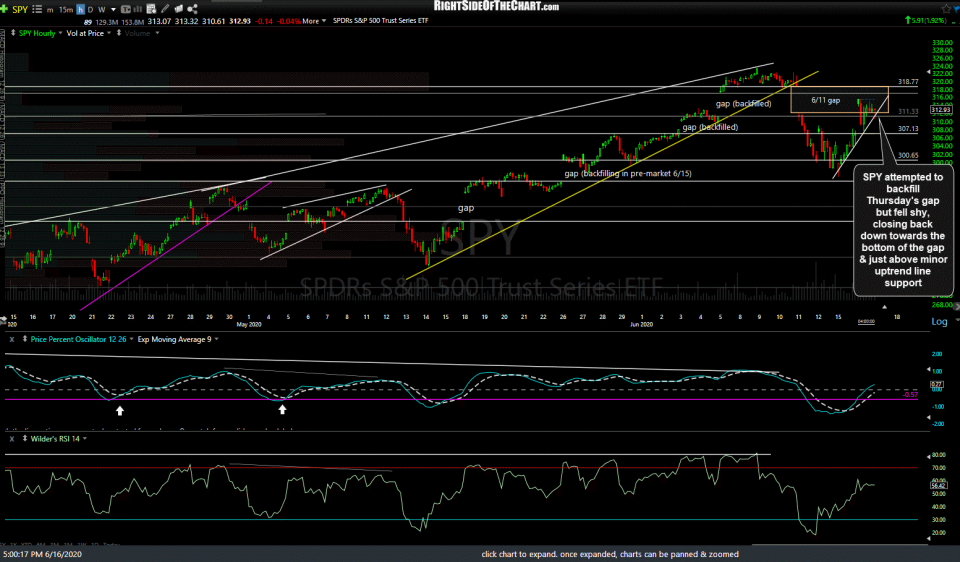
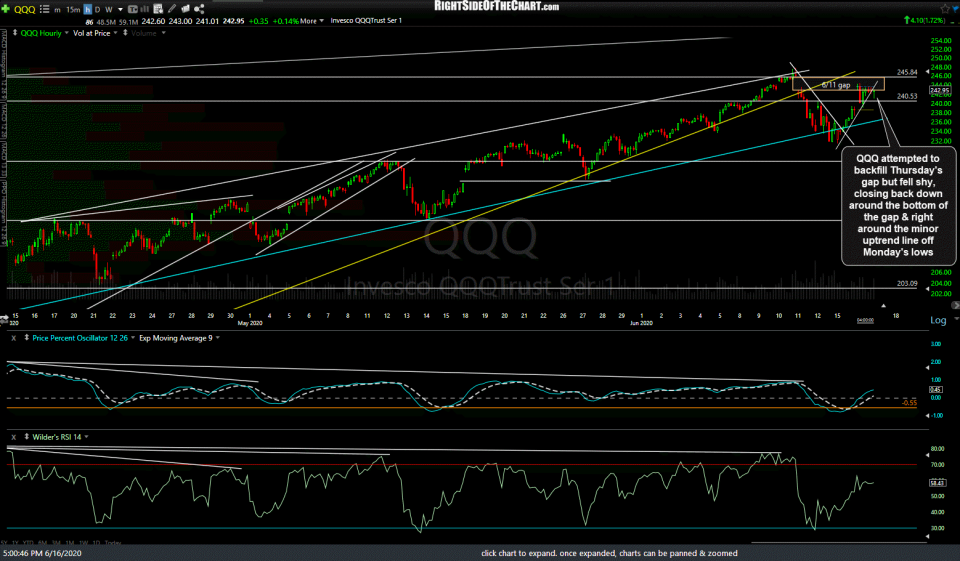
Zooming down to the 60-minute time frames, both SPY & QQQ entered last Thursday’s gaps but failed to backfill them, giving back some of the earlier gains to close around the bottom of their respective gaps. Both SPY & QQQ have some minor uptrend lines forming off Monday’s lows which are likely to spark a wave of selling if both are taken out on a 60-minute closing basis.
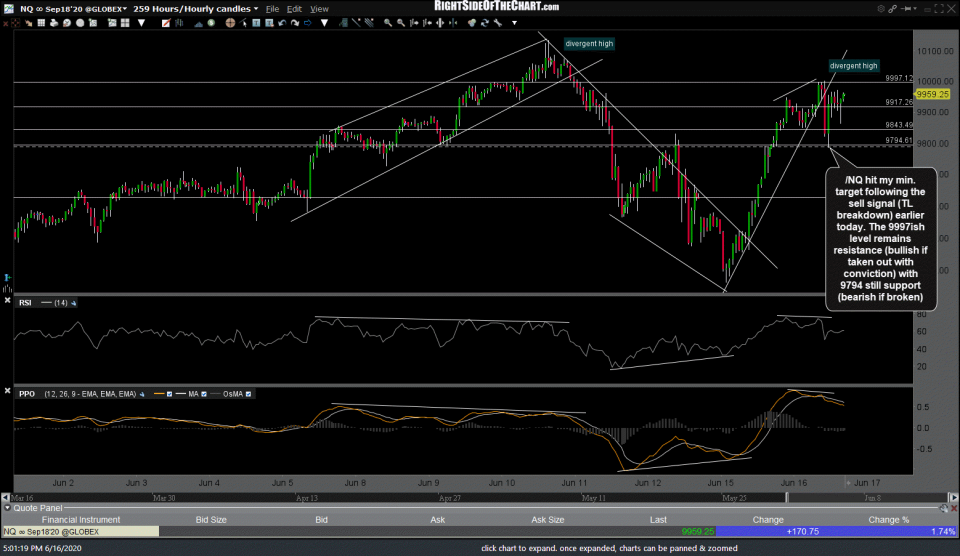
/NQ (Nasdaq 100 E-mini futures) hit my minimum target of 9794 following the sell signal (TL breakdown) earlier today, with the typical reaction off that well-defined support level. The 9997ish level remains resistance (bullish if taken out with conviction) with 9794 still support (bearish if broken). Previous & updated 60-minute charts below.
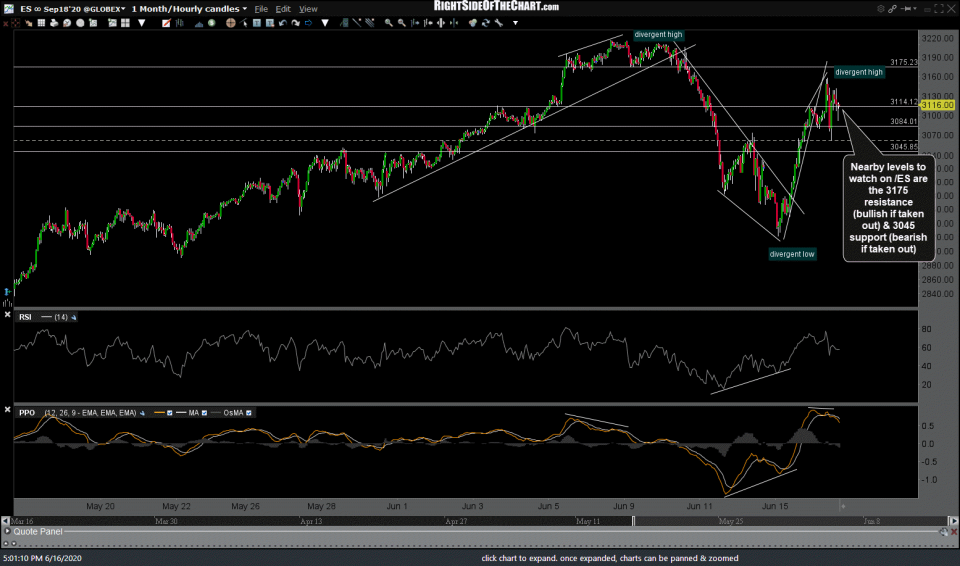
Nearby levels to watch on /ES (S&P 500 futures) are the 3175 resistance (bullish if taken out) & 3045 support (bearish if taken out). Also, note the strong positive correlation between crude & the stock market recently (near-mirror charts).
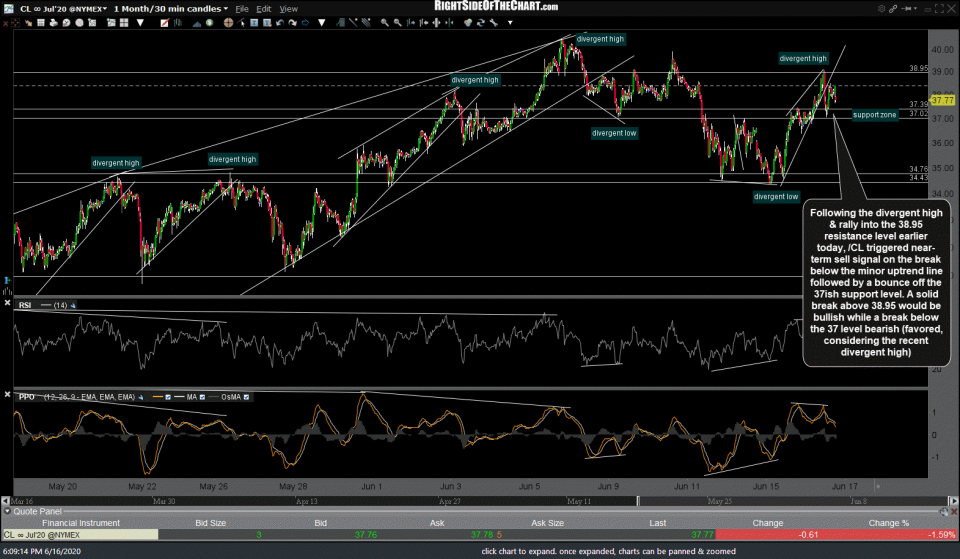
Following the divergent high & rally into the 38.95 resistance level earlier today, /CL triggered near-term sell signal on the break below the minor uptrend line followed by a bounce off the 37ish support level. A solid break above 38.95 would be bullish while a break below the 37 level bearish (favored, considering the recent divergent high).


