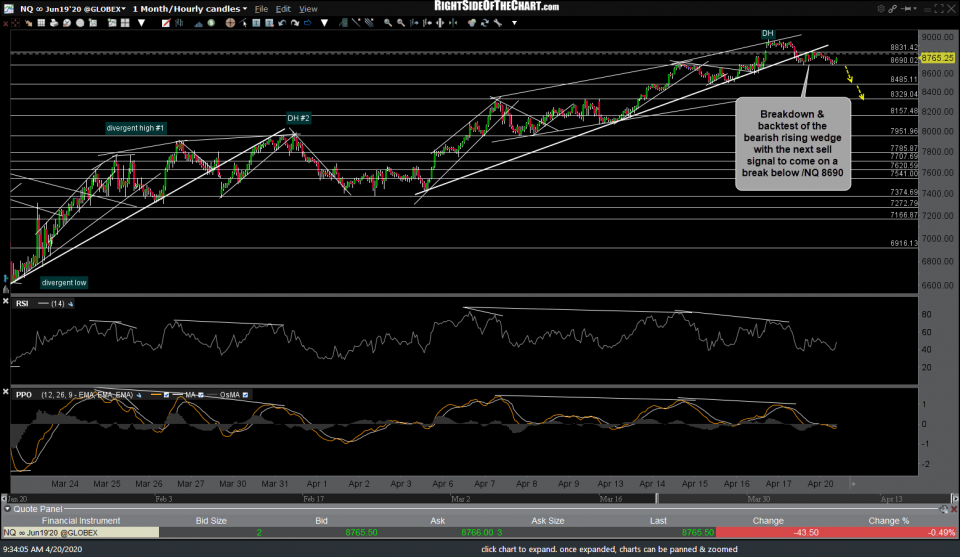
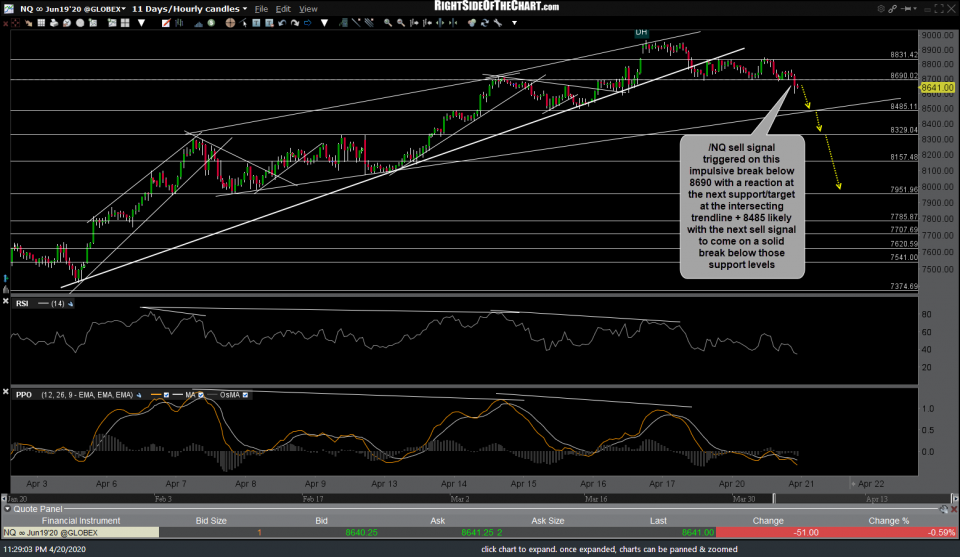
/NQ (Nasdaq 100) sell signal has triggered on this impulsive break below 8690 with a reaction at the next support/target at the intersecting trendline + 8485 likely with the next sell signal to come on a solid break below those support levels. Previous & updated 60-minute charts below (multiple charts in a ‘gallery’ format as below will not appear on email notifications but may be viewed on RSOTC.com).
- NQ 60m April 20th
- NQ 60m 2 April 20th
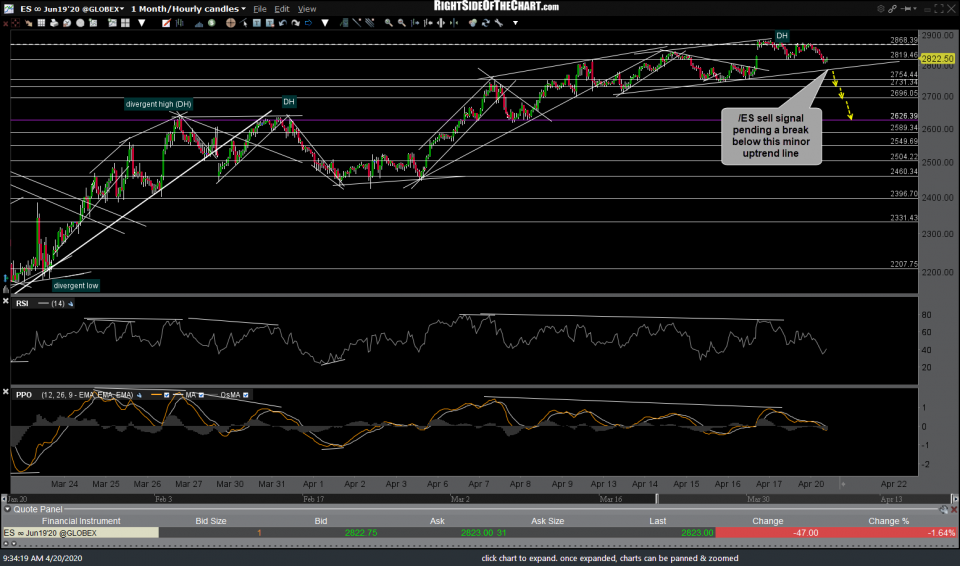
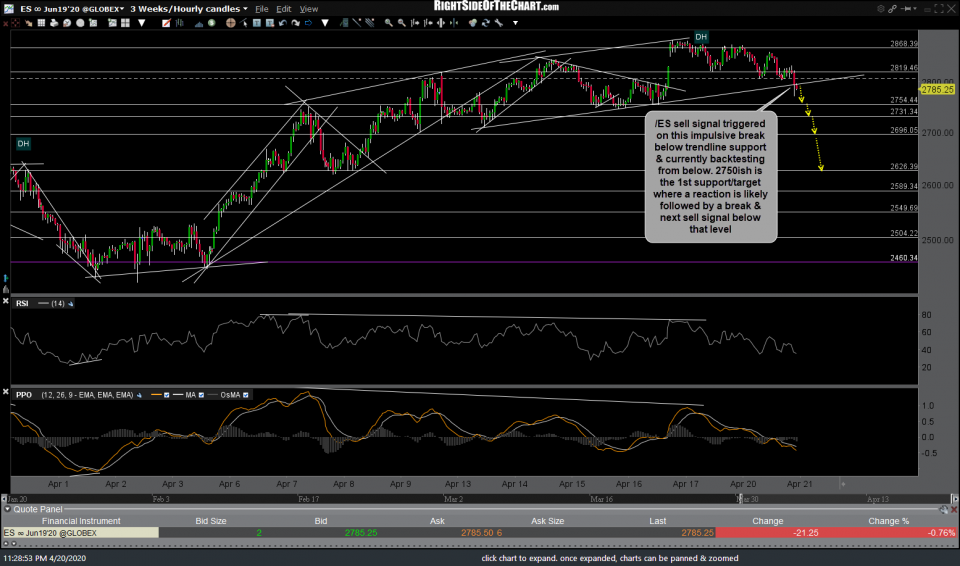
/ES (S&P 500 futures) has also triggered the next sell signal on this impulsive break below trendline support & currently backtesting from below. 2750ish is the 1st support/target where a reaction is likely followed by a break & next sell signal below that level.
- ES 60m April 20th
- ES 60m 2 April 20th
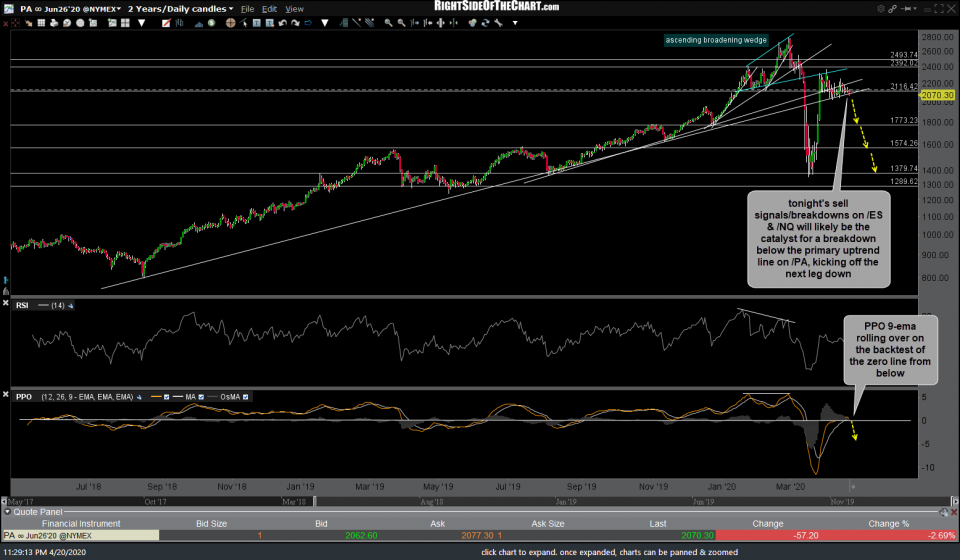
On a somewhat related note, tonight’s sell signals/breakdowns on /ES & /NQ will likely be the catalyst for a breakdown below the primary uptrend line on /PA (palladium futures), kicking off the next leg down in palladium & the PALL Active Short Trade.
While I normally don’t post late-night developments in the stock futures, I wanted to pass these along as well as my thoughts. The breaks below both the previous highlighted support levels on both /ES & /NQ occurred one of the most impulsive drops (largest 60-minute red candlesticks) in weeks. While in no way does that guarantee those breakdowns will or must stick (with more downside to come), it most certainly increases the odds that they will. However, should the futures recover those levels overnight or tomorrow, that will indicate that there are still some strong supply/demand forces in play, whether or not it is direct intervention by the Fed, the PPT, mystical forces, natural buyers or any or all of the above at this point in time.
With that being said, a breakdown (sell signal) is a breakdown until & unless those levels are clearly regained so as of now, the charts indicate more downside to the next support/target levels below & quite possible much more although we’ll have to take the technical developments one day at a time as we head into the thick of earnings season.


