The S&P 500® is widely regarded as the best single gauge of large-cap U.S. equities. There is over USD 7.8 trillion benchmarked to the index, with index assets comprising approximately USD 2.2 trillion of this total. The index includes 500 leading companies and captures approximately 80% coverage of available market capitalization. (source: S&P Dow Jones Indices)
As such, the S&P 500 is widely consider one of the most representative indexes of the U.S. stock market. In order to get a read on where the stock market is likely headed, I find it helpful to analyze each of the eleven sectors that comprise the index. The video above is a follow-up to the May 8th S&P 500 Sector Analysis post (with static charts) of those eleven sectors, covering the developments that have occurred over the past 5 weeks as well as the outlook for each of those sectors going forward & some key technical levels & developments to watch for.
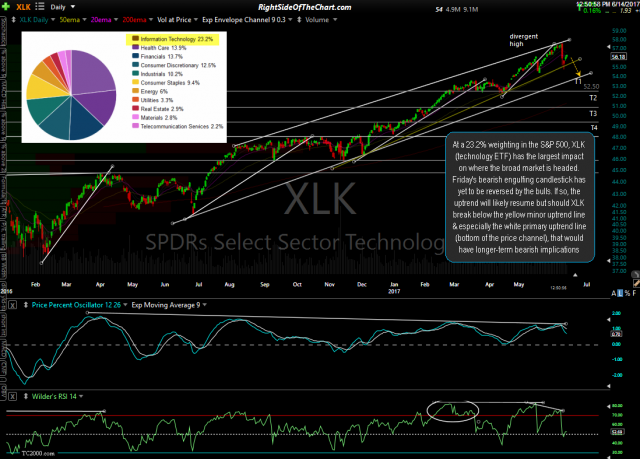
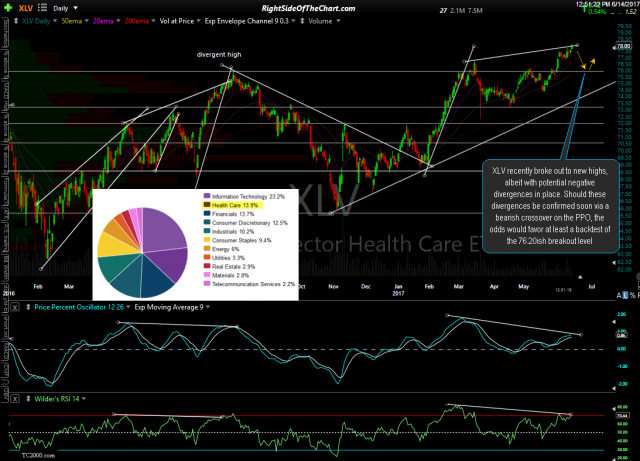
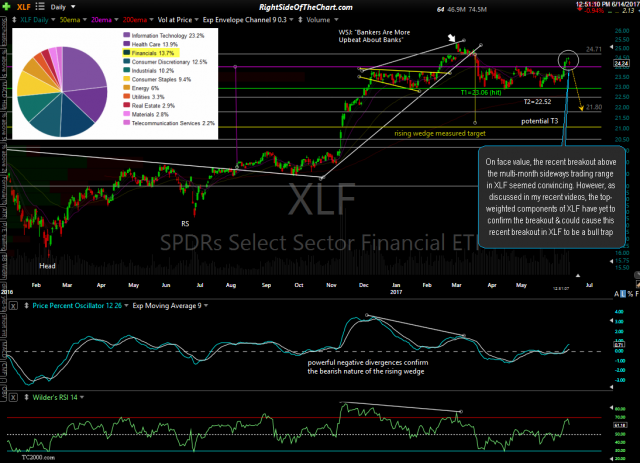
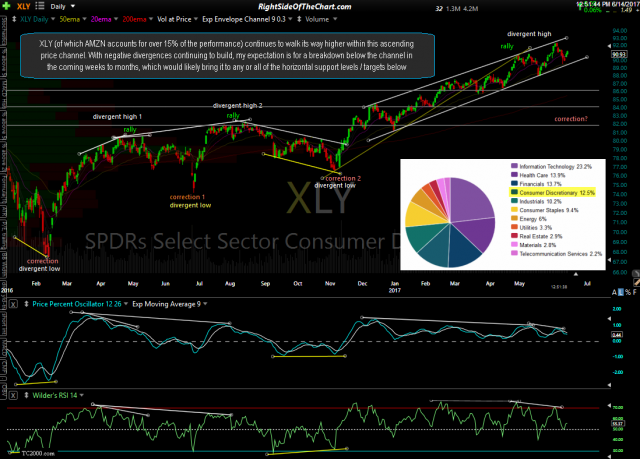
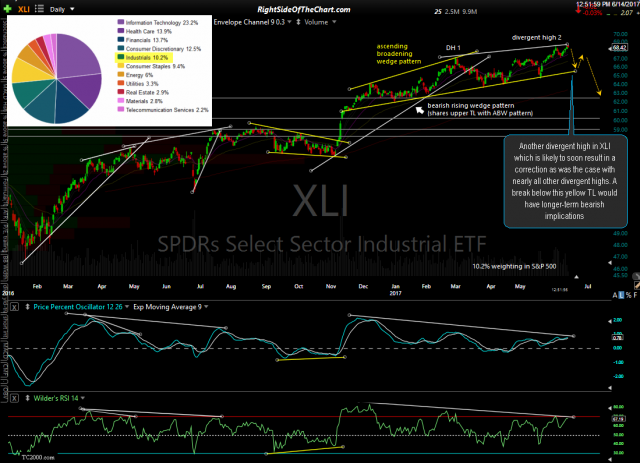
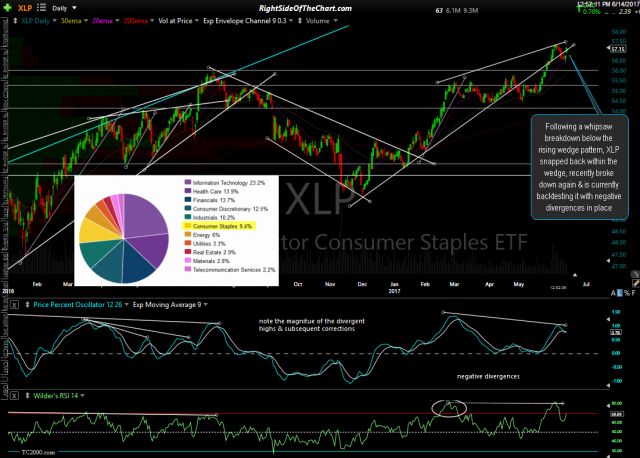
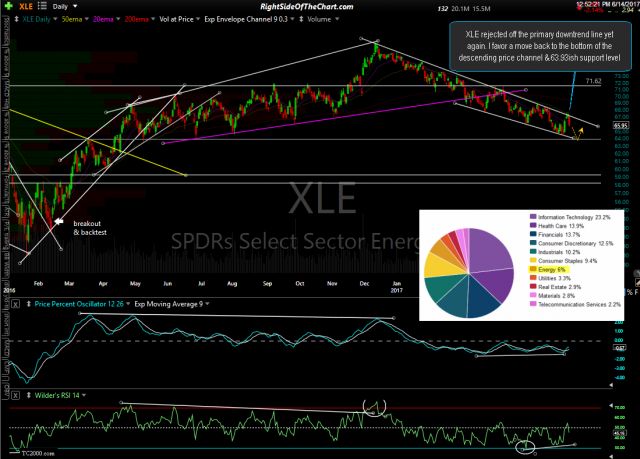
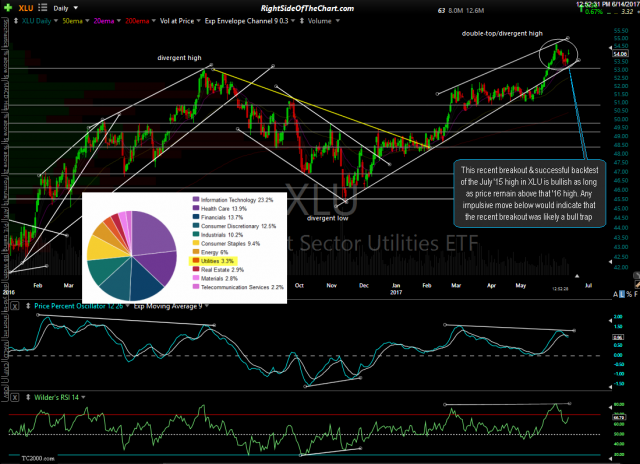
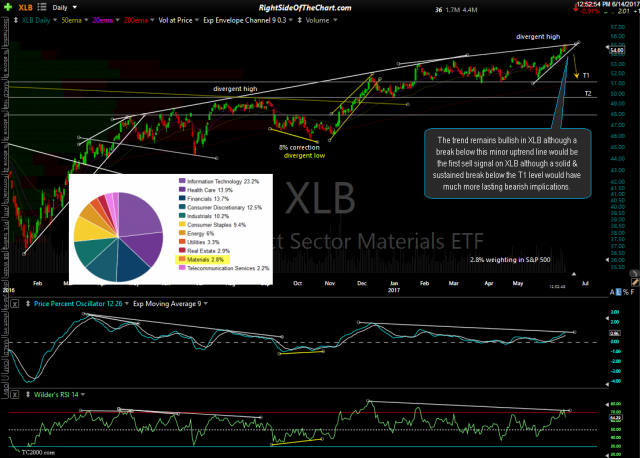
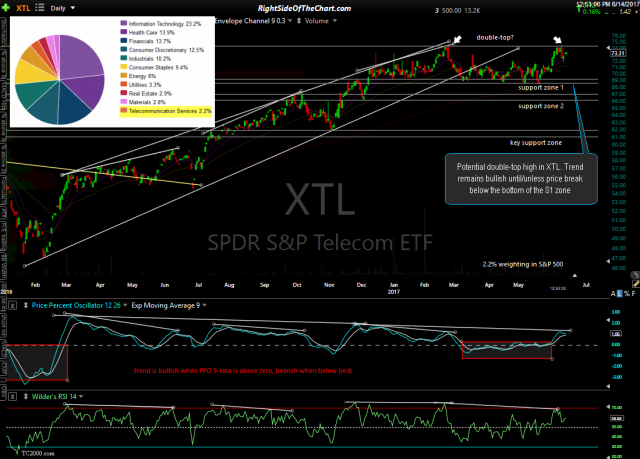
As in that previous post as well as the static chart images below, the sectors are covered in descending order by weighting in the S&P 500, as those sectors with the highest weighting will have the largest impact on the performance of the index. As it takes a while to discuss all of these sectors in detail, I have included screenshots of each of the charts below, also in descending order of their weighting in the index. Click on the first chart below to expand, then click anywhere on the right of any expanded chart to advance to the next chart image. Once expanded, the charts can be panned & zoomed for additional detail.
- XLK daily June 14th
- XLV daily June 14th
- XLF daily 2 June 14th
- XLY daily June 14th
- XLI daily June 14th
- XLP daily June 14th
- XLE daily June 14th
- XLU daily June 14th
- IYR daily June 14th
- XLB daily June 14th
- XTL daily June 14th


