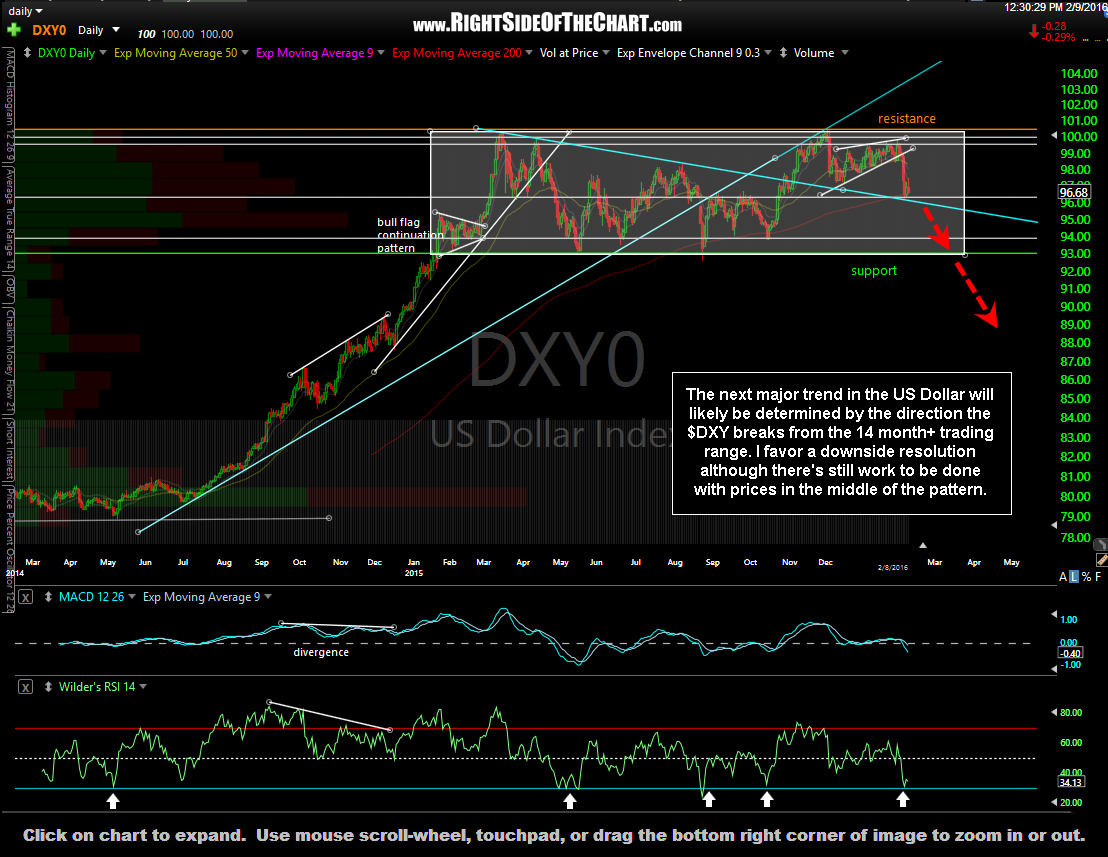
The following video is a comprehensive look at the near-term, intermediate-term & longer-term outlook for the US Dollar. Although I don’t actively trade currencies, I do follow the US Dollar, as well as the Euro & the Yen, very closely to get a better idea of where dollar sensitive assets such as gold and select commodities are likely headed.
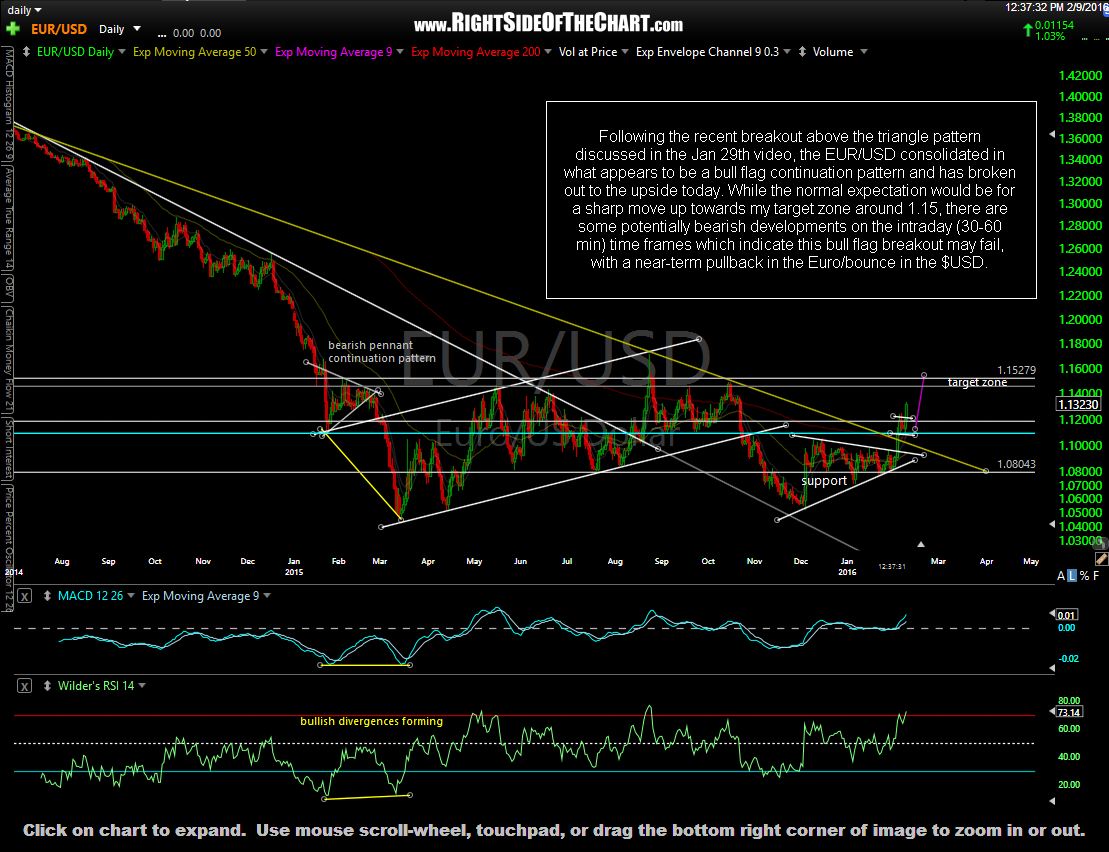
Following the recent breakout above the triangle pattern discussed in the Jan 29th video, the EUR/USD consolidated in what appears to be a bull flag continuation pattern and has broken out to the upside today. While the normal expectation would be for a sharp move up towards my target zone around 1.15, there are some potentially bearish developments on the intraday (30-60 min) time frames which indicate this bull flag breakout may fail, with a near-term pullback in the Euro/bounce in the $USD.
With potential divergences forming, should the EUR/USD reverse soon & confirm the divergence, a move down to the bottom of & likely a break below this rising wedge would result in a bounce in the $USD and a pullback in gold & GDX. Clarification between potential & confirmed divergence is discussed in the video. Until/unless these divergences are confirmed, there is a good chance that the bull flag breakout in the EUR/USD will play out, causing the dollar to continue to fall until my target zone on the daily chart above is hit. Bottom line, I don’t have a very strong read on whether or not this 60-minute pullback scenario (i.e.- bounce in the $USD) will play out or not but it is worth keeping an eye on as it would cause the bull flag breakout above to fail.


