
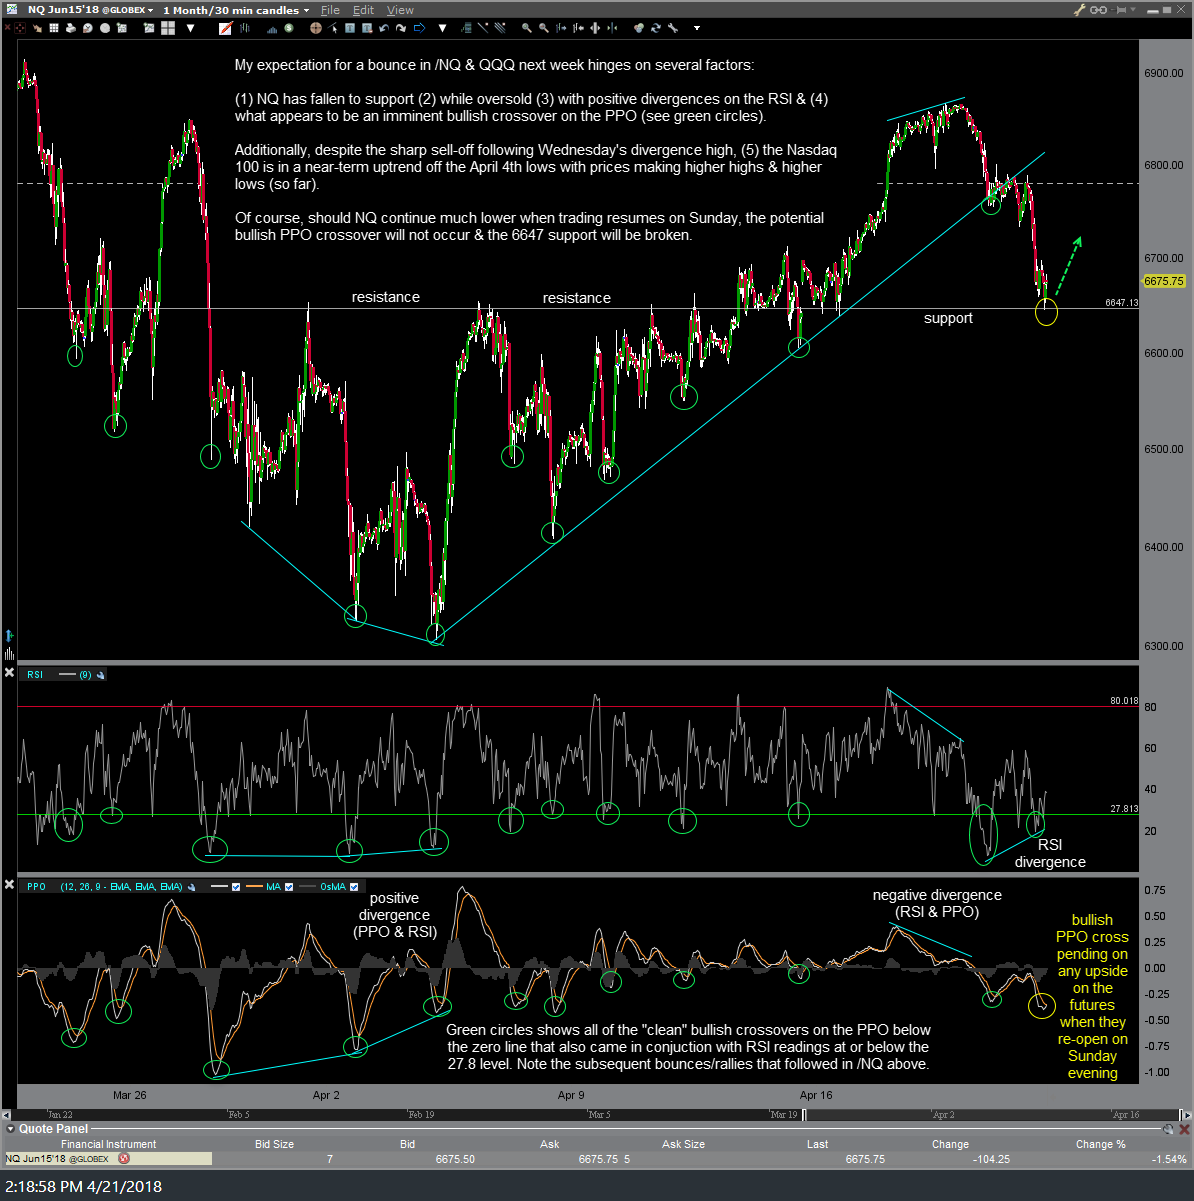
As a follow up to yesterday’s comments & expectation for a bounce in the Nasdaq 100 following the sharp correction off Wednesday’s highs, I’ve highlighted five of the reasons why I favor a bounce in the US equity markets early next week on this 30-minute chart of the Nasdaq 100 E-mini futures (/NQ). My expectation for a bounce in /NQ & QQQ next week is the result of numerous technical developments on the intraday time charts:
(1) NQ has fallen to support (2) while oversold (3) with positive divergences on the RSI & (4) what appears to be an imminent bullish crossover on the PPO (see green circles). Additionally, despite the sharp sell-off following Wednesday’s divergence high, (5) the Nasdaq 100 is in a near-term uptrend off the April 4th lows with prices making higher highs & higher lows (so far).
Should NQ happen to continue much lower when trading resumes on Sunday, the potential bullish PPO crossover will not occur (i.e.- no buy signal triggered) & the 6647 support will be broken. Unless any substantial break below 6647 doesn’t prove to be a fleeting stop-raid/whipsaw signal (which is fairly common in the low-volume overnight futures trade session), with that level regained on Monday, it would increase the chance of additional downside in the stock market next week. However, I believe the odds are clearly in favor of the bullish scenario barring any significant headline risk that could occur over the weekend & overwhelm this bullish technical setup.
/NQ 60-minute chart April 21st
click chart to expand. once expanded, use scroll-wheel or touchpad to zoom & pan for additional detail.
The potential bullish setup on the S&P 500 E-mini futures (/ES) looks even more solid than /NQ as the $SPX futures have ‘potential’ positive divergences on both the RSI as well as the PPO. I refer to those divergences, as well as those on NQ, as ‘potential’ divergences as I consider the divergences confirmed if & when the PPO makes a bullish crossover, thereby putting in a higher or equal low against prices making a lower low. Essentially, any upside in the major stock indices next week will help to firm up the near-term bullish case while any substantial downside (1%+), especially as the regular trading session gets well underway, will chip away at the near-term bullish outlook for the markets this week.
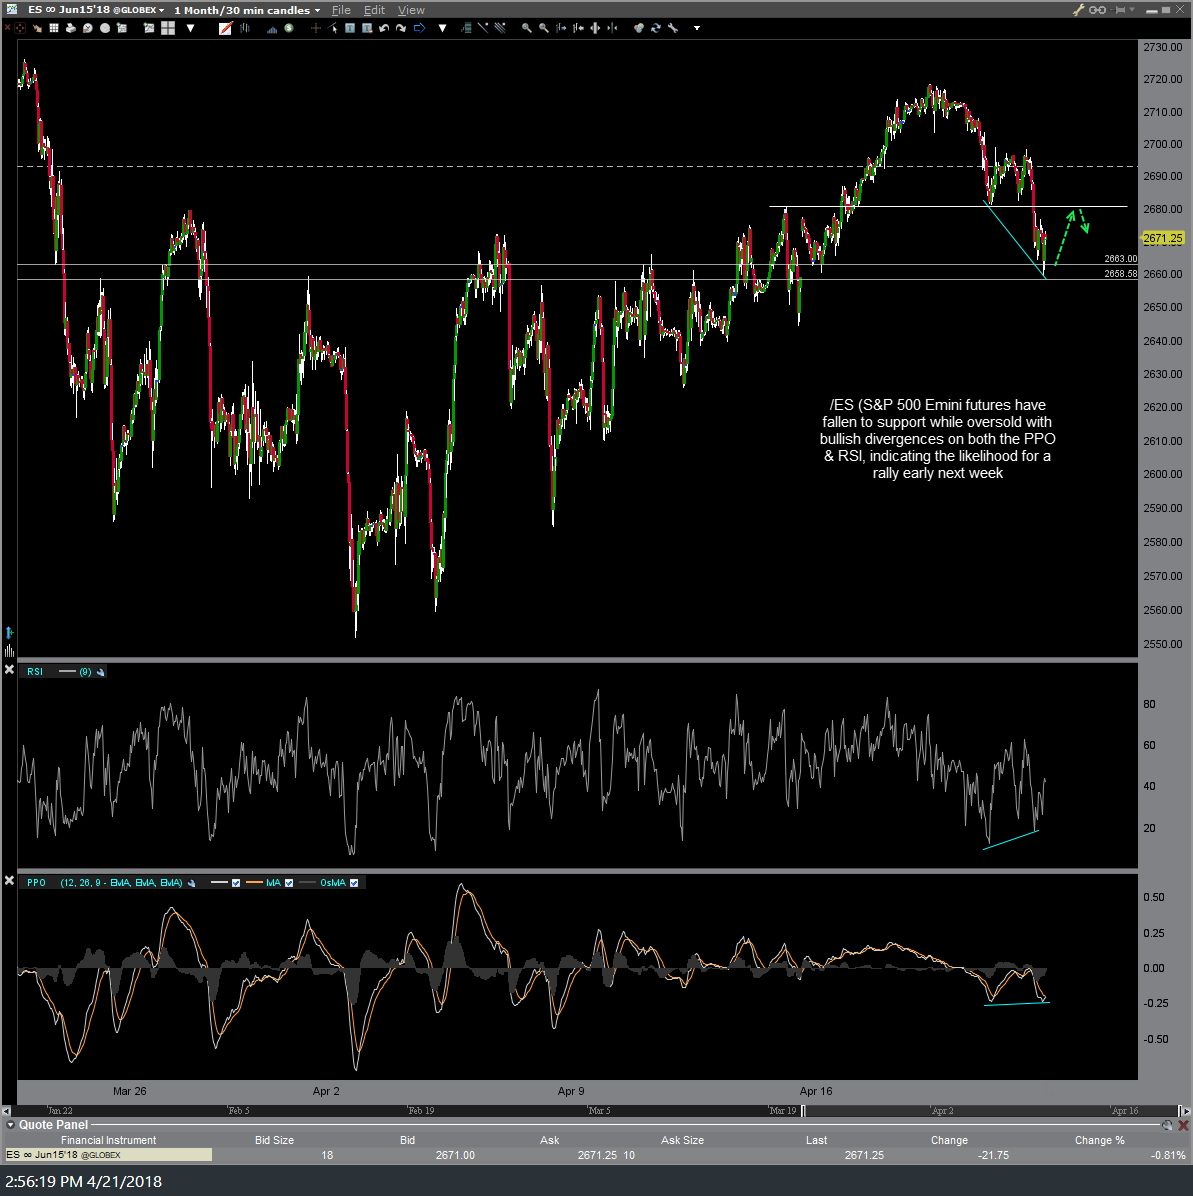
/ES 60-minute chart April 21st
As of now, I remain in active trading mode which is akin to swing trading with the fast-forward button on 3x or higher speed. I came into the week long the $NDX via /NQ, closing that position (along with the official long swing trade on QQQ) on Tuesday & reversing to a short position just before the market topped on Wednesday in anticipation of the pullback, then closing that short on Friday & once again reversing back to a long position which I plan to most likely close out this week whether my bounce target is hit or the markets continue lower & I’m stopped out.
I realize that the recent surge in volatility, with seven different price swings (bullish & bearish micro-trends) in the major stock indices so far in 2018 ranging from 5-12% and lasting just days to weeks has likely caused a lot of frustration to both investors & less-active swing/trend traders alike. Volatility rarely stays this high for more than a few months & will most likely begin to abate soon but until then, one must acknowledge the current trading environment for what it is and decide whether to attempt to take advantage of the volatility & rapidly changing near-term technical outlook for the markets by adapting to a more active trading strategy or stand aside while keeping things light if that does not mesh with your trading style, risk tolerance or comfort level.
On a related note, the majority of the swing trade ideas on Right Side Of The Chart since the surge in volatility so far this year have been profitable with quite a few already closed out & several still active with the final price target or maximum suggested stop level yet to be reached. For less active swing traders, trend traders & investors, trading during periods of high volatility such as this, will simply require patience.
While I can’t give individual investment advice, I will say that for my typical swing trades (those with holding periods usually measured in weeks or months vs. days as with the very short-term trades on NQ & QQQ mentioned in recent weeks), my strategy is the same as during any other market conditions: Once I’ve taken a position in a trade, only after identifying why I am buying (or shorting) the position, where I plan to book profit(s) and where I plan to stop out if the trade goes against me, I will then set my sell limit order(s) at my profit target(s) along with my stop-loss order(s) at my pre-determined stop levels using an OCO order(s) and let the position ride unless the technical outlook for that position and/or the broad market or sector that it has a strong correlation to has clearly changed.
Second guessing a position every time it moves against you unless the outlook for that trade has clearly changed, often leads to one taking profits too soon or closing trades early for a loss before the stop allowance that you had originally outlined in your trading plan. Taking profits early can be okay at times, especially if you find that you are losing sleep at night or constantly worrying about the position. However, over time, booking profits early while allowing your losses to run to or beyond your original stop is a sure path to losing money.