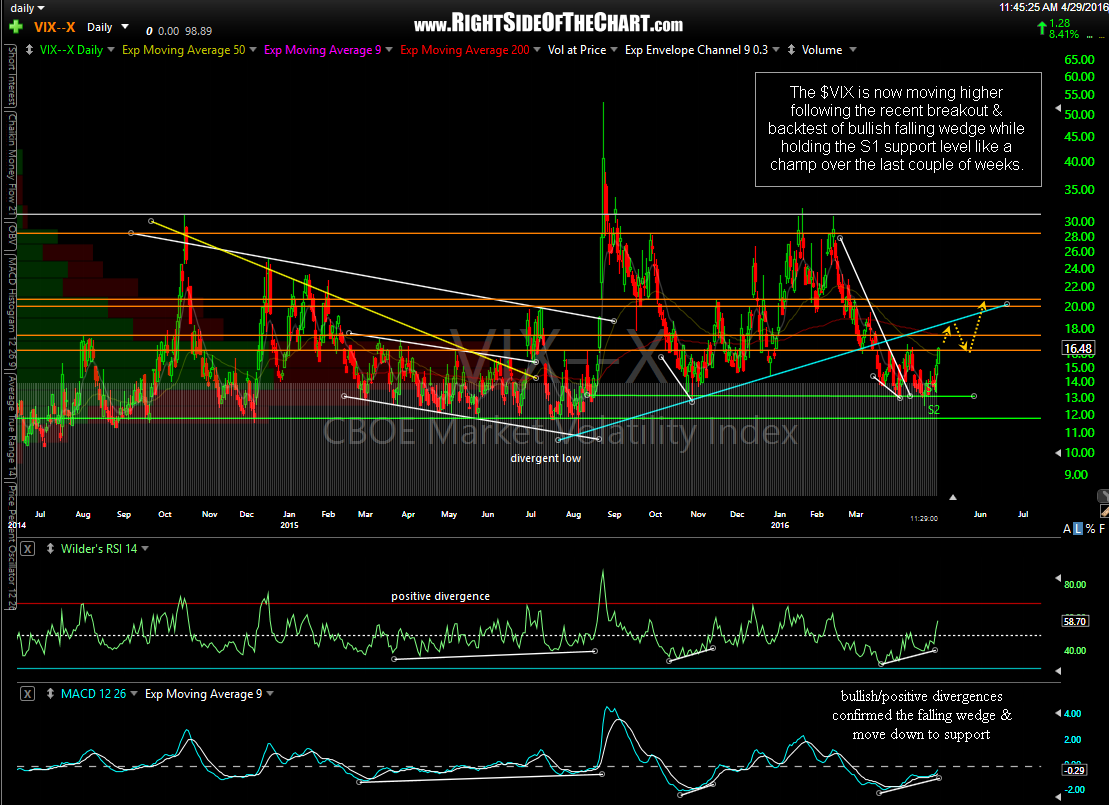
The $VIX (Volatility Index) is now moving higher following the recent breakout & backtest of bullish falling wedge while holding the S1 support level like a champ over the last couple of weeks. The positive divergences in place at the recent lows confirmed the bullish nature of the falling wedge pattern & helped to confirm the likely trend reversal that appears to now be underway. The scenario drawn on this chart is just a guesstimate of how the $VIX might play out going forward & although I’m not trading the $VIX, if I were, then I would put as much or more focus on where the broad market (equities) are likely to experience reactions/bounces off support, more so that solely focusing on the chart of the $VIX to determine where to book profits or reverse a long trade (I know several here recently went long volatility.. congrats so far!) Previous & updated $VIX daily & 120-minute charts:
-

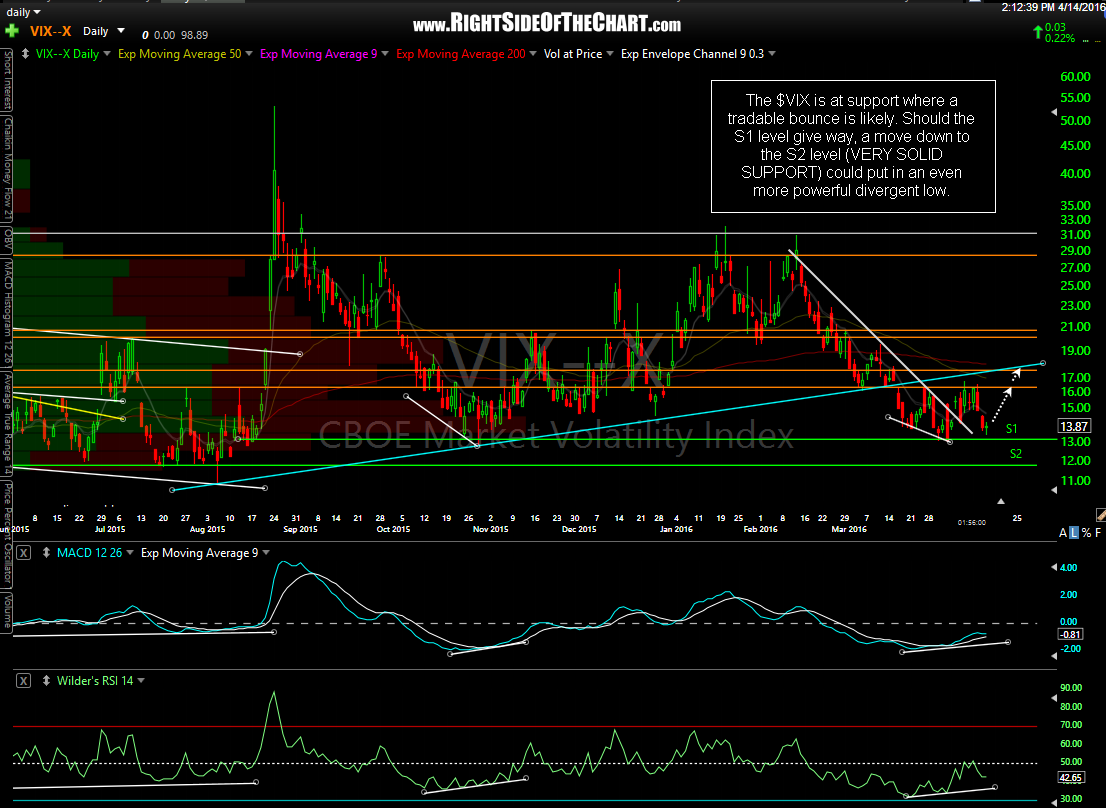
- $VIX daily April 14th
-
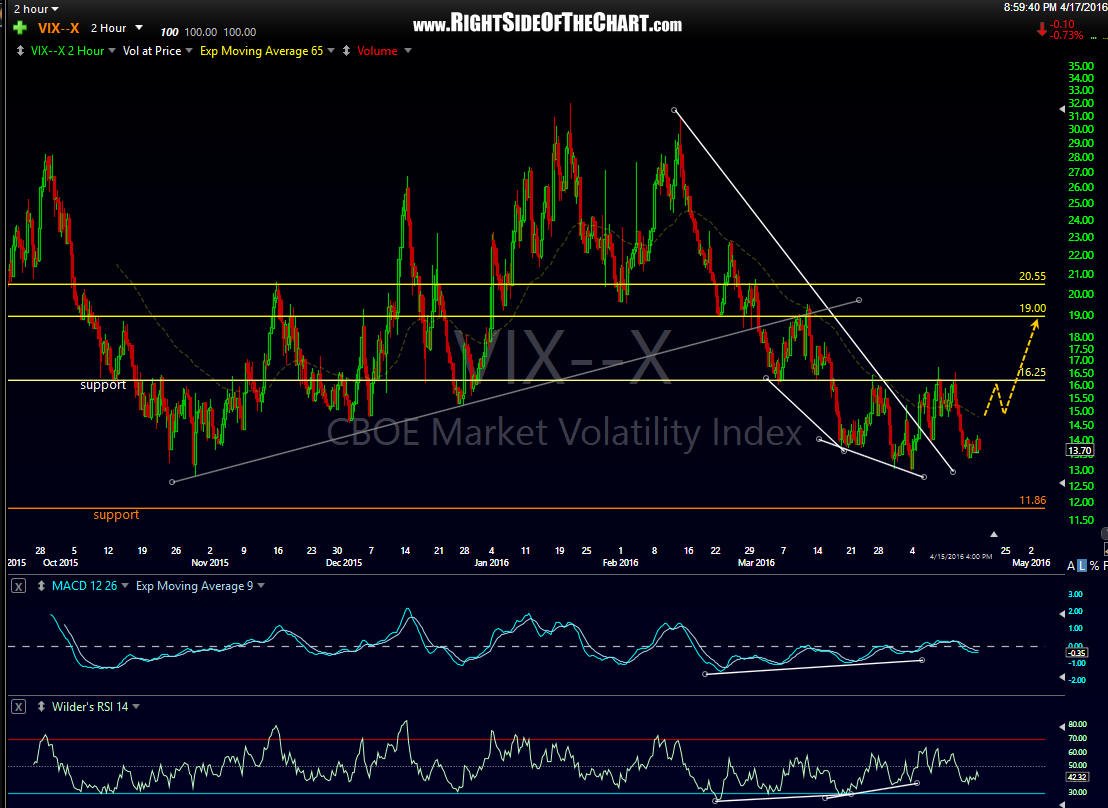
- $VIX 120-minute April 17th
-
- $VIX daily April 29th