
/ZN (10-yr Treasury bond futures) is currently testing the 110’256ish support with a solid break below likely to take it down to the next support around 109’300. Support is support until/unless broken so watching the 10-yr closely here as a rally off this level should help stocks with a solid drop below bearish for equities. 120-minute chart below.
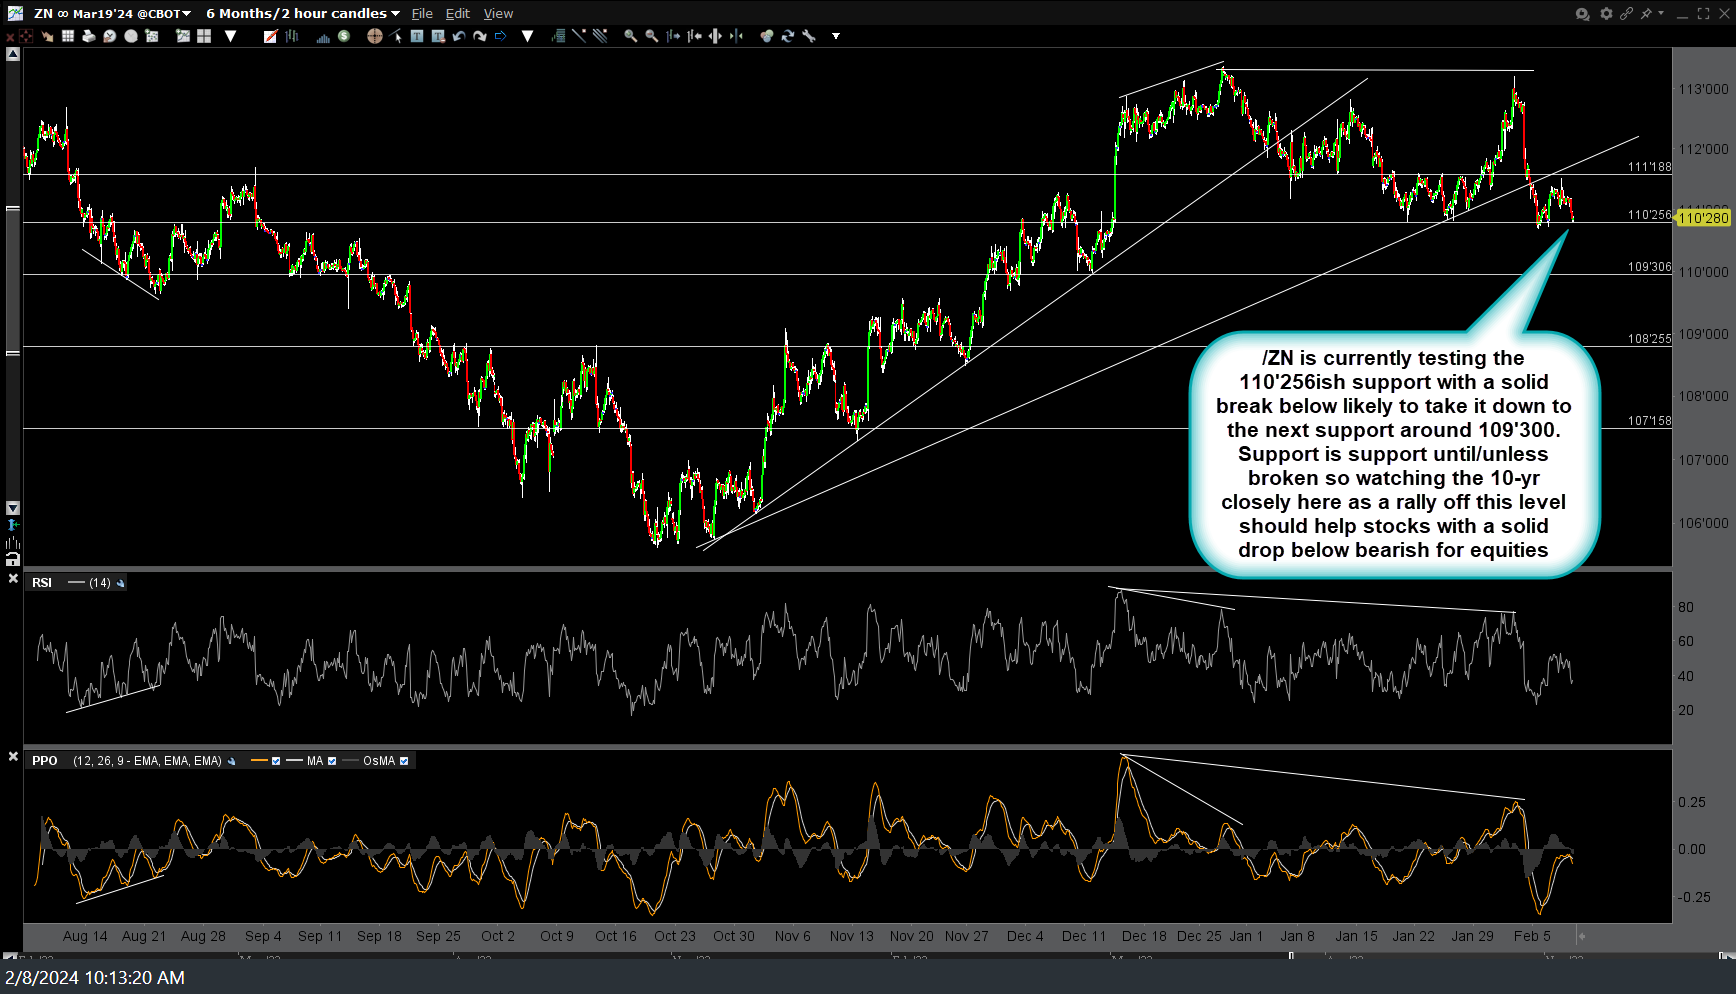
ZN 120m Feb 8th
In a pretty simplistic/color-coded view using IEF (7-10 yr Treasury bond ETF), IEF is currently testing the 94.50ish support following the recent breakout & backtest: Net bullish for stocks if it can rally off this support, bearish if it clearly falls into the yellow zone, where the stock market will likely start to take note of rising yields. (Again, net bullish for stocks if Treasuries can hold & rally off this support level).
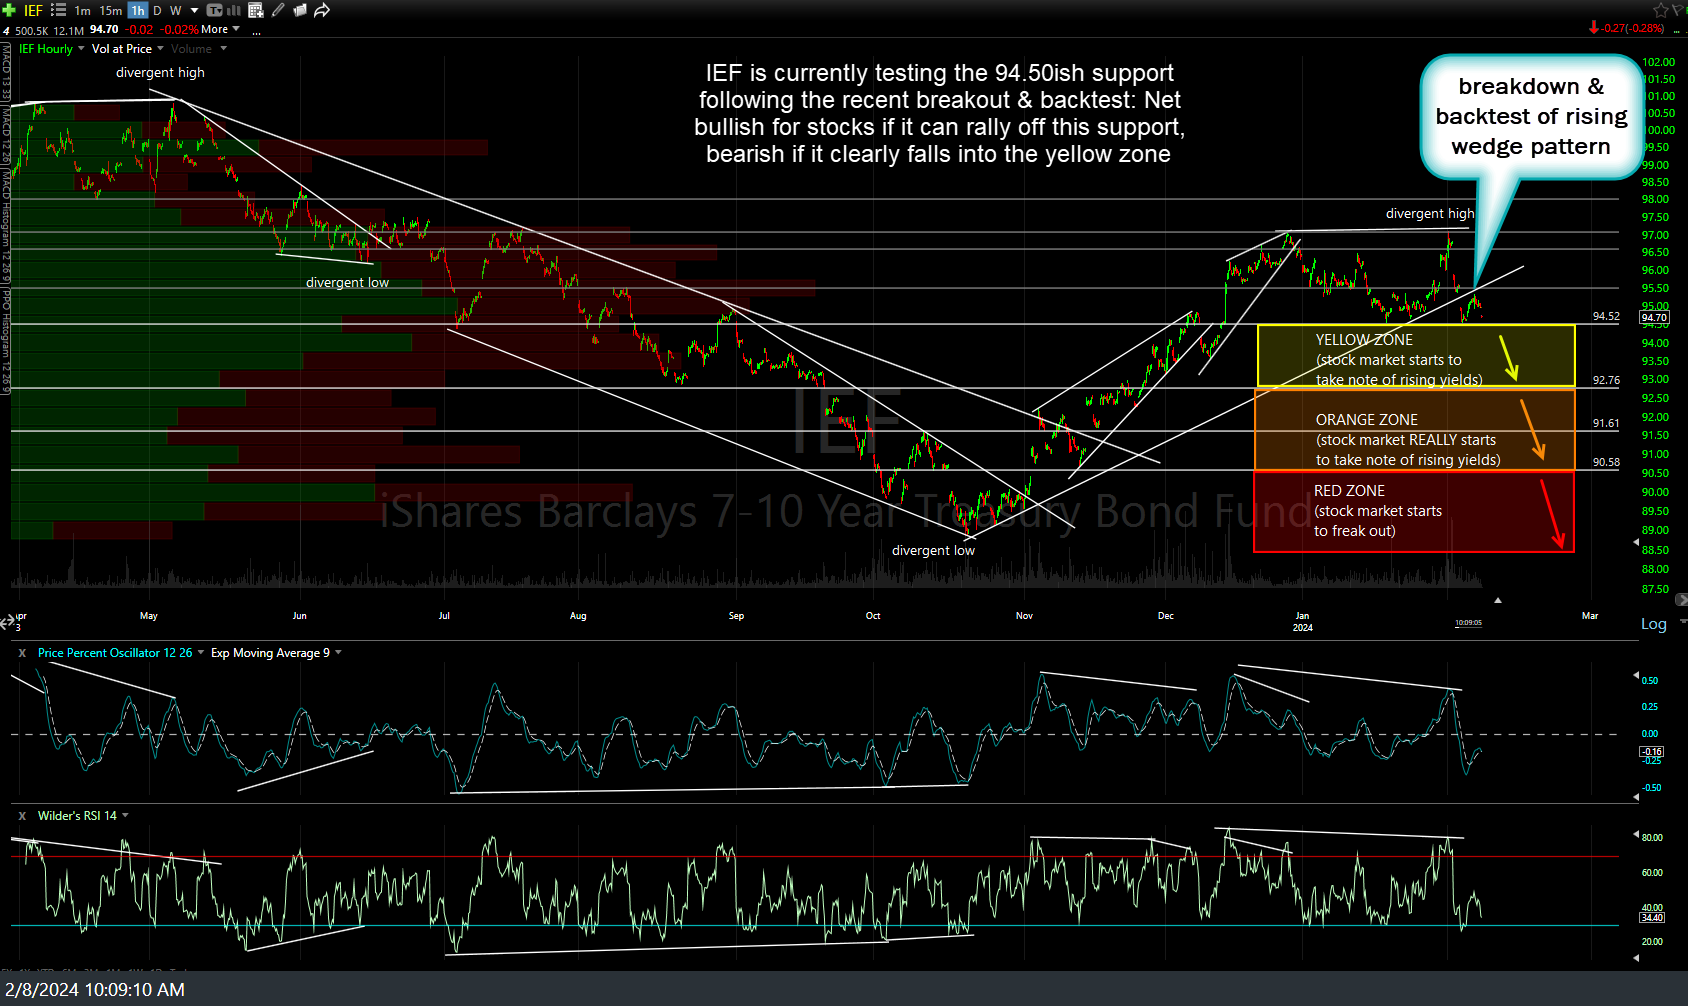
IEF 60m Feb 8th
While I’m sharing these charts primarily to help gain some insight to the next direction in the stock market, those interested in trading Treasuries could go long here (if bullish) with stops somewhat below or short (if bearish) on a solid break of these support levels on both IEF & /ZN. Nearby support & resistance levels (i.e.- potential price targets) are shown on both charts.