
The arrow breaks on the 60-minute (TLT), 120-minute (/ZB), & daily (TLT) charts below are potential price targets for a long position on the long bond (30-yr US Treasury bond), which has fallen to support on the daily time frame with bullish divergences still building on the 60 & 120-minute intraday time frames.

TLT 60m Jan 18th
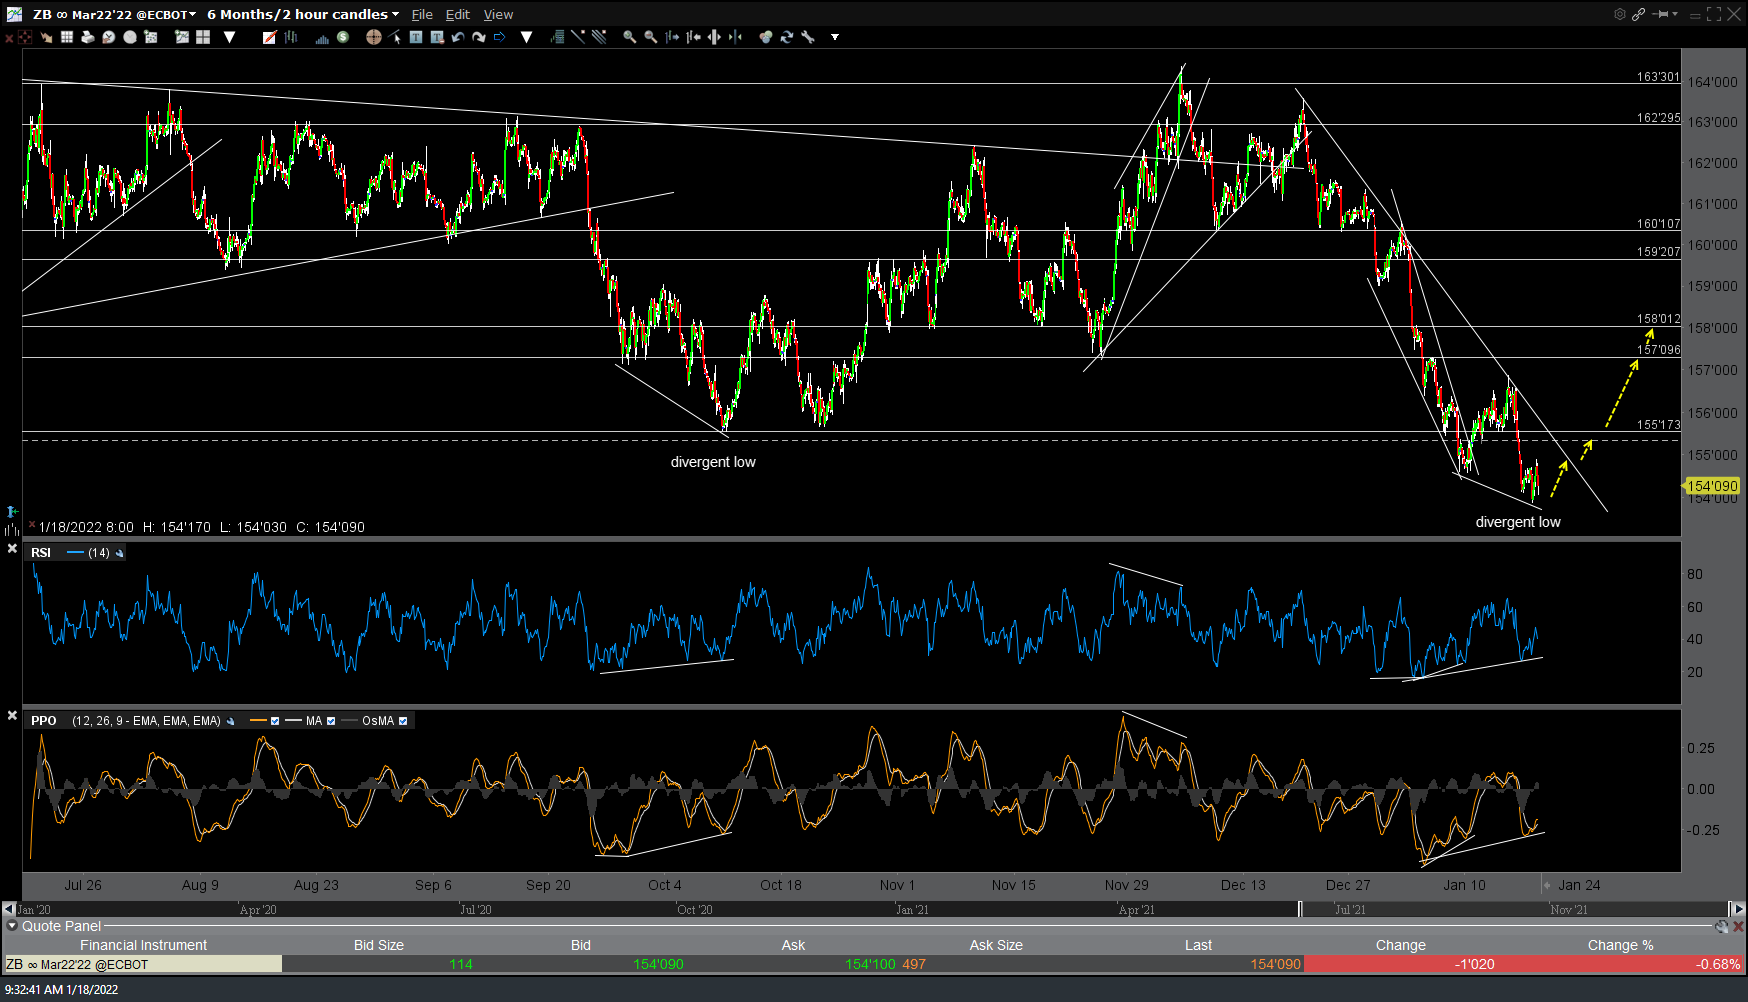
ZB 120m Jan 18th

TLT daily Jan 18th