
The yellow (caution) flags that I’ve been highlighting in the banking sector (both the regionals & TBTF mega-banks) for the past month continue to inch closer to morphing into red (warning) flags. After stating it was time to start shorting the regional banks about a month ago, KRE went on to form the recently highlighted bear flag continuation pattern (daily time frame) & went on to trigger the next sell signal/objective short entry on the impulsive breakdown below the flag on Wednesday, printing another confirming (red) candlestick yesterday. Should we get another red close today, that would be indicative of the typical impulsive selling that follows a breakdown below a bear flag pattern.
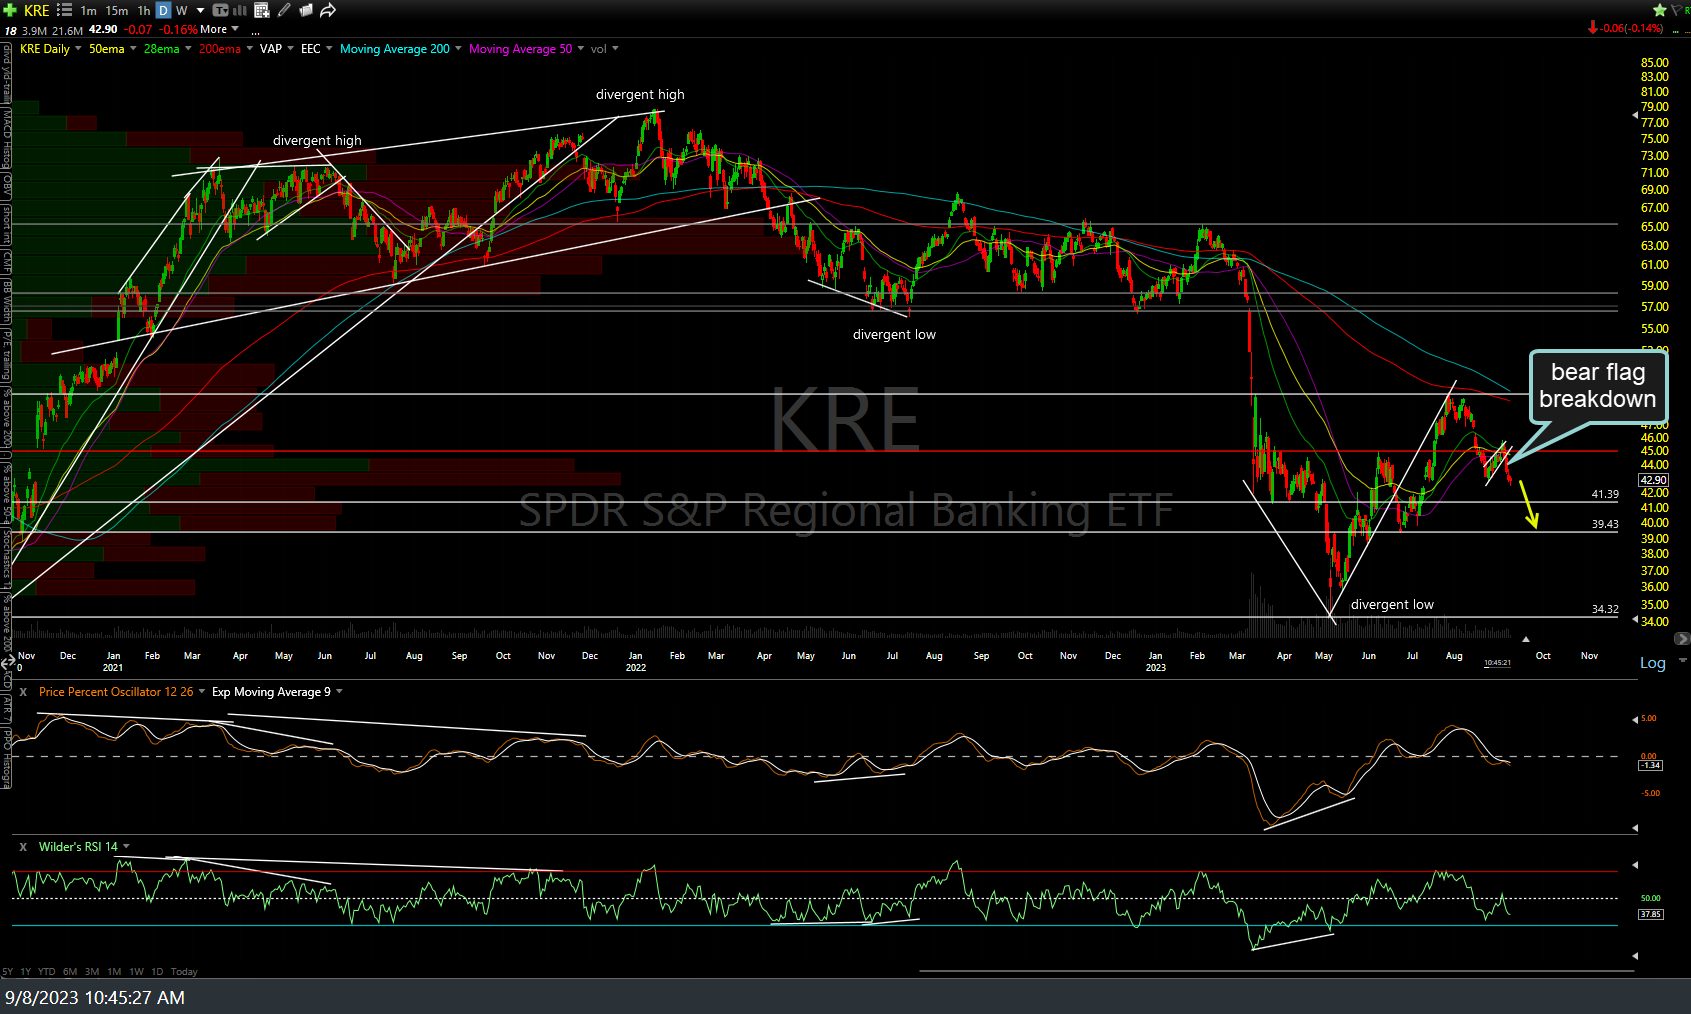
KRE daily Sept 8th
Up until what is now known as the 2023 United Stated Banking Crisis earlier this year, regional banks were not considered TBTF (too big to fail)… until those three failed earlier this year (retroactively being labeled TBTF in order to support the extreme measures taken by the Fed). While individually, any one regional bank failure in-itself can relatively easily be managed by the virtually unlimited powers of the Federal Reverse & unlimited resources of the Federal Government, collectively the regional banks pose a very significant systemic risk to the US & even global financial system. Again, only a yellow flag at this time, IMO, but certainly a sector worth monitoring going forward, especially if/when the current downtrend begins to threaten a break below the May 4th lows.
Moving to the extreme opposite end of the banking sector (from small to large) is undisputed heavy weight king of the banking sector, JP Morgan Chase & Co. (JPM). As the daily chart below shows (and highlighted quite a bit in recent videos), the bear market counter-trend rally off the mid-Oct divergent low appears to have come full circle as of the July 31st divergent high & subsequent recent breakdown below the primary uptrend line off that Oct ’22 low (which formed a large bearish rising wedge with the divergence line on top).
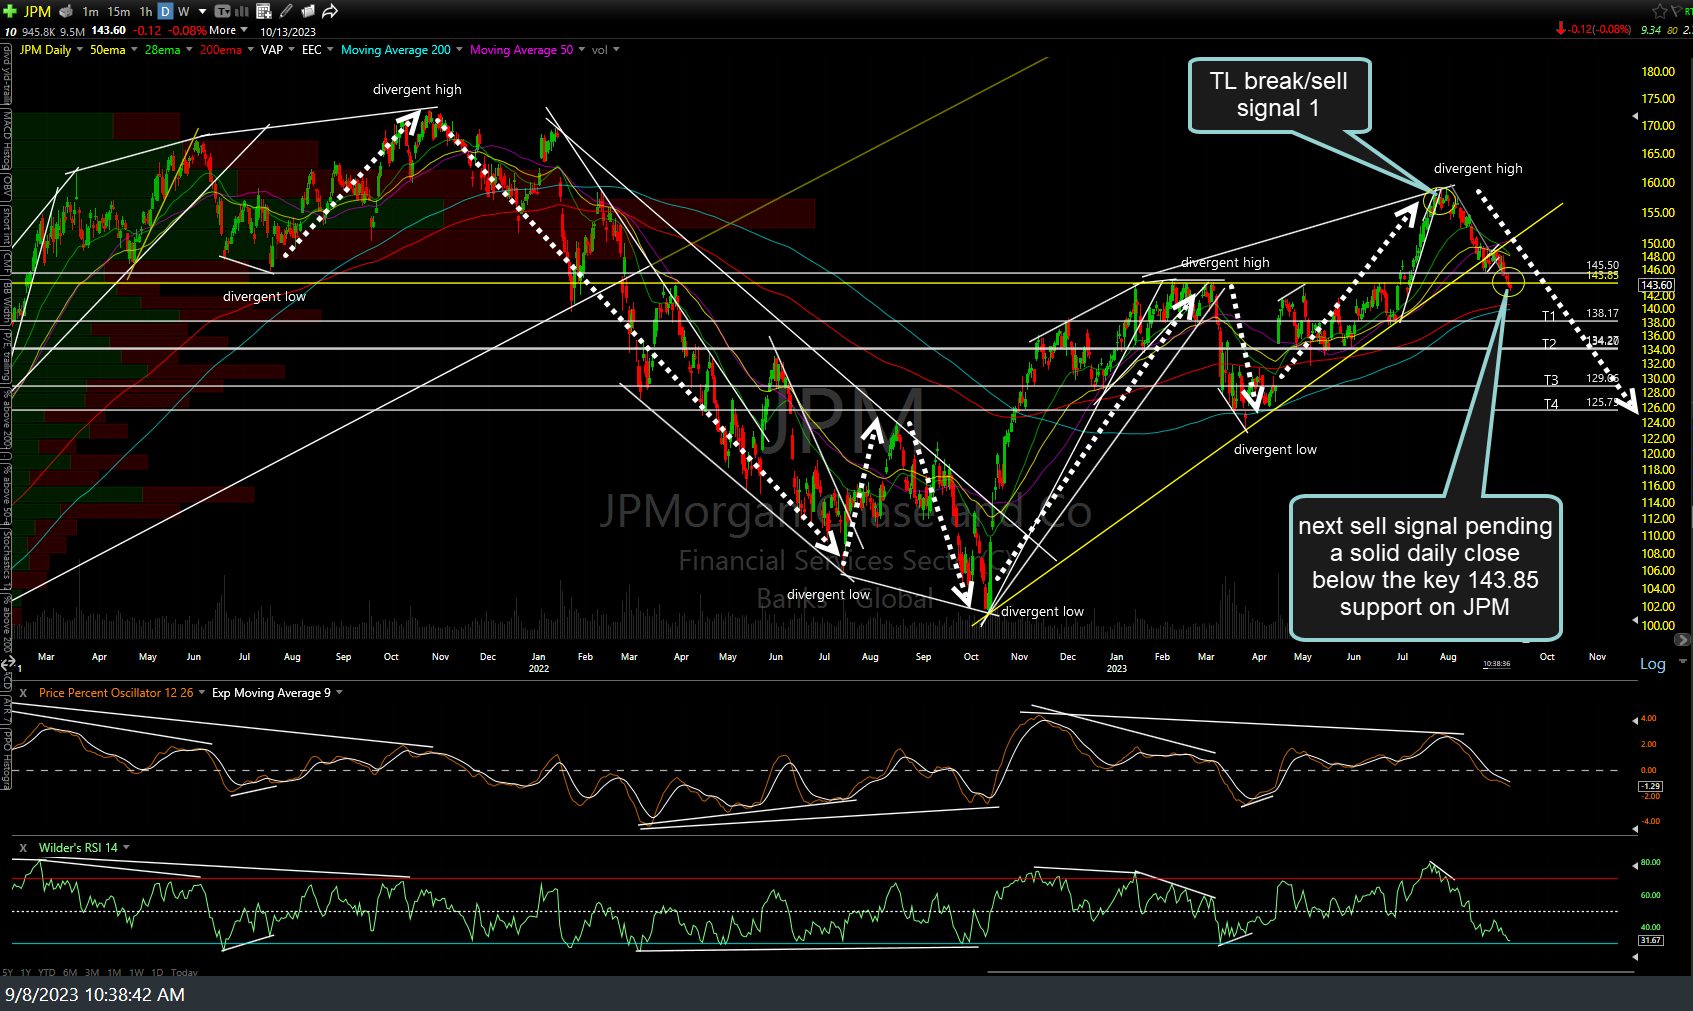
JPM daily Sept 8th
JPM is now testing that key 174.85ish support that I’ve been highlighting recently as my “BOD” or benefit-of-the-doubt support level as it is very well-defined support that comes in just below the recently broken uptrend line. At the risk of oversimplifying things, as there are numerous other key stocks, sectors, & other developments to watch for, a solid close below this key support that JPM is currently testing would be bearish for the stock and as the largest bank, also bearish for the financial sector as a whole. Of course, as I often say: Support is support until & unless broken so just something to monitor for now & for those already short or considering shorting JPM and/or XLF (financial sector ETF), I’ve included the four initial price targets on the daily chart above.
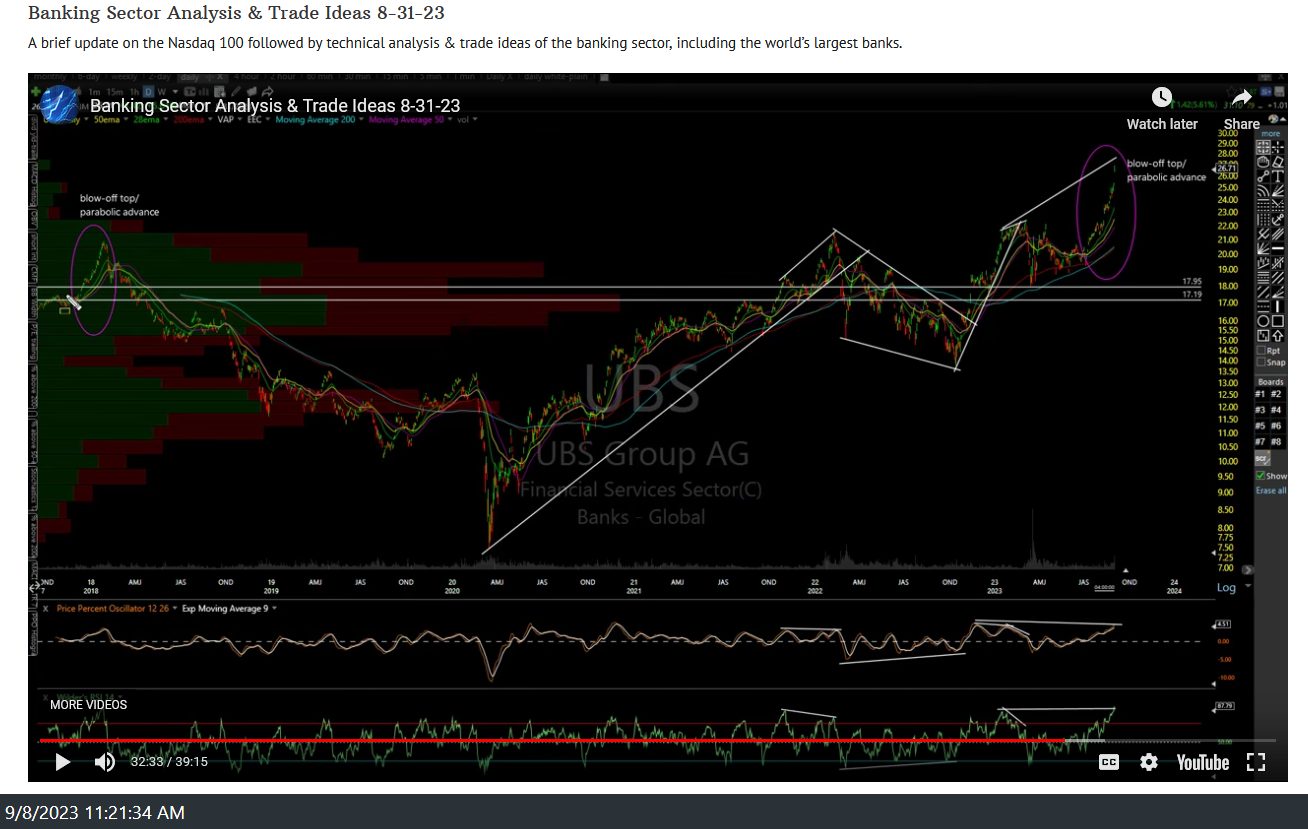
UBS video screenshot Aug 31st
JPM is far from the only major bank that has been selling off while the tech sector has rallied over the last few weeks. For example, along with many other of the world’s largest banks (including US, Europe, Canada, & Japan), I highlighted what appeared to be a parabolic/blow-off in UBS in the Aug 31st video (screenshot from that video above), with the stock already falling over 6% since then, in the impulsive manner that typically follows a blow-off top. However, it is worth noting that just like JPM is testing key support today, UBS is as well as it has currently fallen to the bottom of the big Aug 30th/31st gap. As such, I’d say the odds for a reaction in the big banks are elevated at this time although bounce or no bounce, a solid move & daily close below today’s lows would increase the odds of more downside in the banks & financial sector. If & when that happens, the stock market (and financial media) will likely start to take note of the problems in the banking sector.
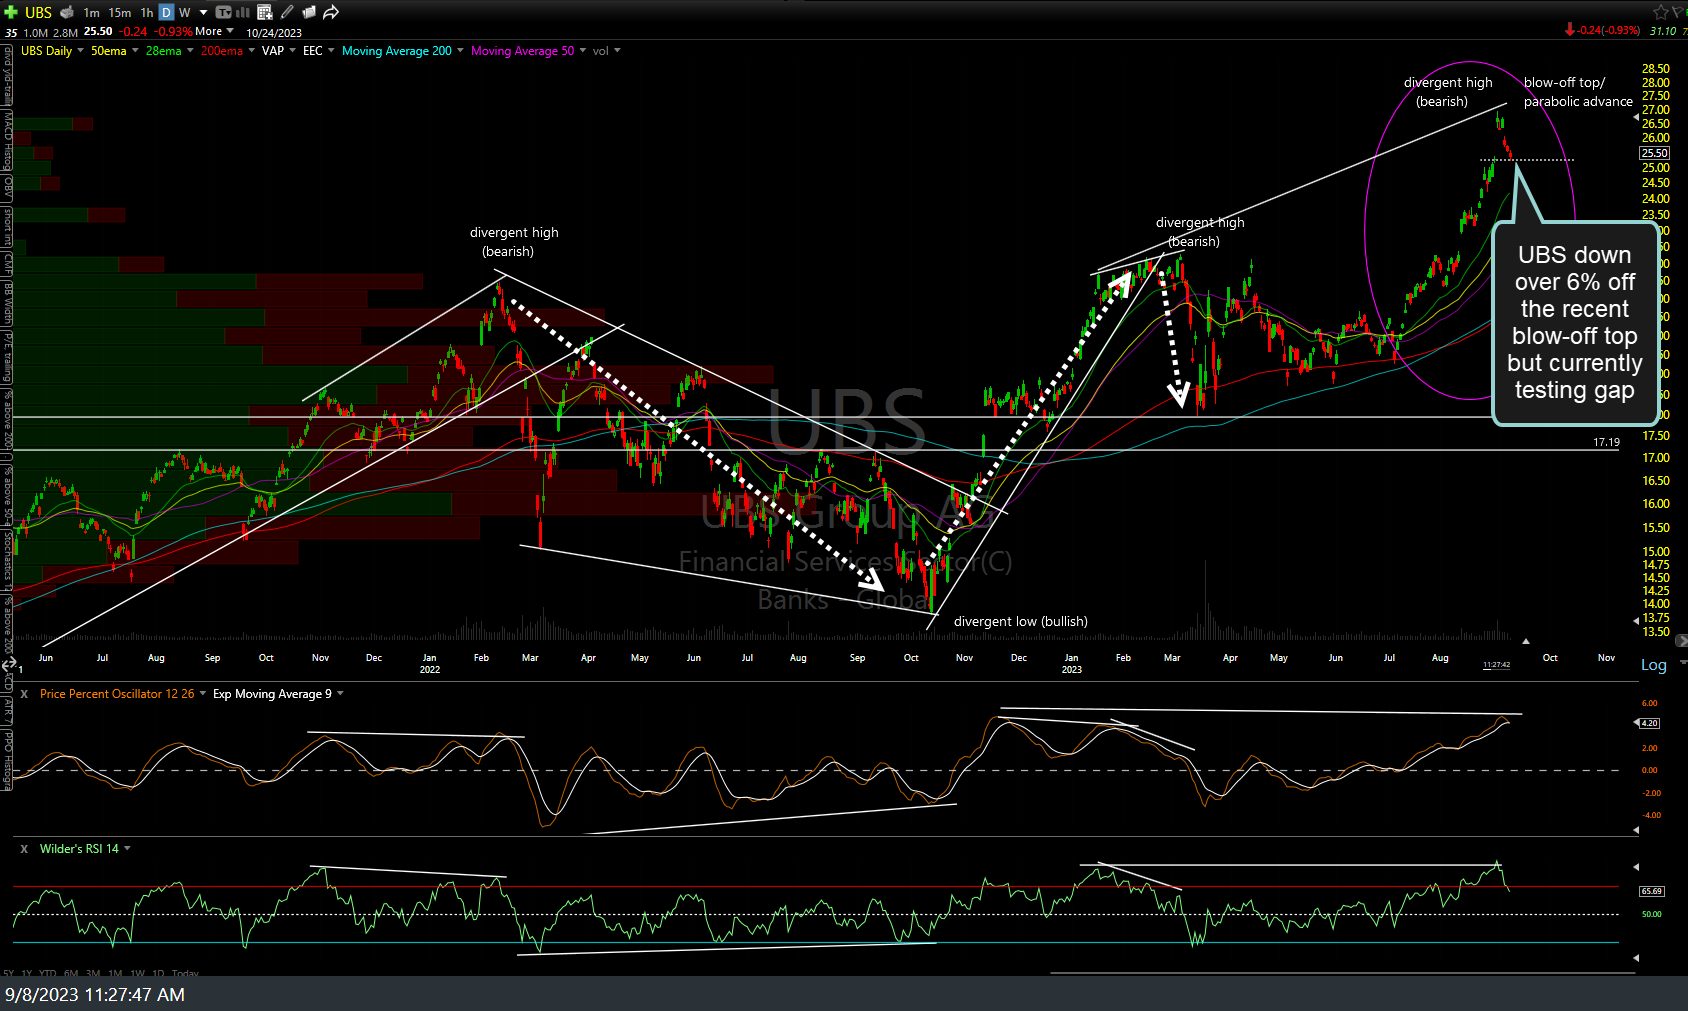
UBS daily Sept 8th