
Shortly after closing out the previous FAS short trade for a 29% gain in exactly one month, with a nearly perfectly timed exit on the morning the big August 24th meltdown, FAS (3x long financial ETF) was once again posted as a new short setup in this post last week & went on to trigger an entry later that day when XLF dropped below 22.95.
At the time I had stated that price targets & suggested stops would follow. I’ve spent quite a bit of time studying the charts of the top components in the financial sector and it appears very likely that most are poised to fall another 10%, plus or minus a couple of percentage points, from current levels. Should XLF make a solid breakdown below the current bearish pennant continuation pattern that prices have been hammering out since the Aug 24th plunge, the 21 area would be the most likely target. That would constitute a drop of about 8% from current levels and correlate to the 18.60ish area on FAS (my preferred shorting proxy for this trade). The suggested stop, should the current XLF/FAS triangle/pennant pattern resolve to the upside, will be any move above 29.15.
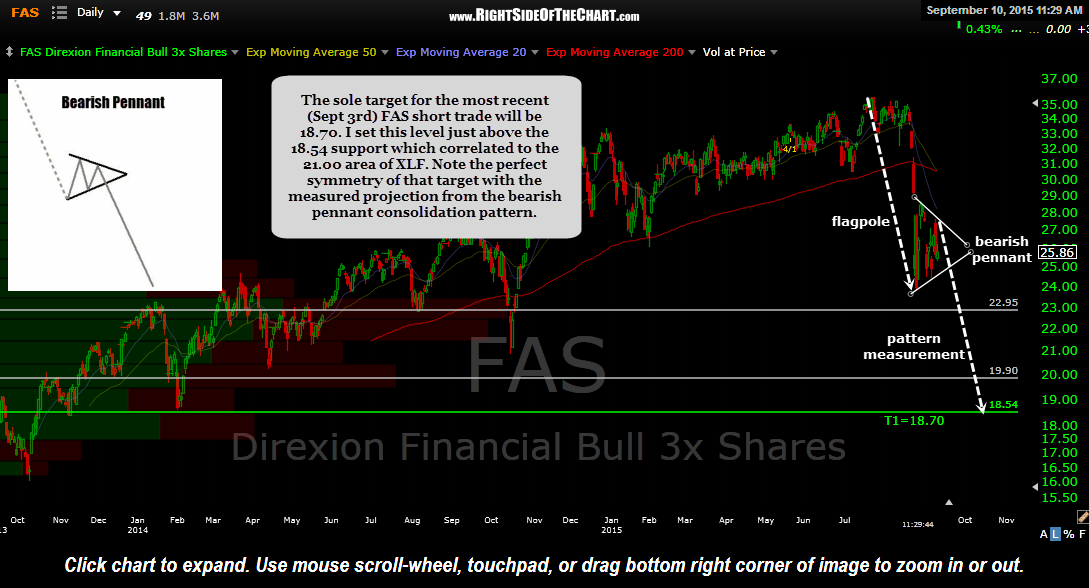
FAS daily Sept 10th
After setting the price target on FAS, I decided to scrub it with the measured move for the bearish pennant pattern. To do so, I simply drew a line from the July 23rd highs down to the bottom of the triangle (i.e.- the “flagpole”). To calculate the measured move for a bearish pennant pattern you simply add that distance to the final tag of the top of the pattern (I took the liberty in assuming yesterday’s tag was the final tag). No need to pull out a calculator as this is only a rough guide anyway. I simply make a duplicate copy of the flagpole, then drag it to the top of the pattern. This provides both a projected price target and should this pattern play out as expected, the downside move following a breakdown of a bearish pennant is usually similar to the intensity of the initial move leading down to the formation of the pennant (which is simply a consolidation period that allows the very oversold near-term conditions to alleviate). Therefore, the lower arrow also gives us a rough estimate of how long FAS might take to get there. I can’t tell you how many times I’ve seen these patterns, along with their closely related cousins, bull & bear flags, play out with almost perfect symmetry & right on or near the measured target.
As with any technical pattern, this may or may not play out as expected and most importantly, we need to see a solid & impulsive breakdown below the bearish pennant in order to increase the odds that it does. I have also added a couple of interim unofficial price targets using the white horizontal lines. Note that those lines show the actual support levels. As always, I find it best to set my buy-to-cover limit order slightly above the actual support levels to help minimize missing a fill, should the stock reverse just shy of support.
FAS remains both an Active Trade as well as a Short Trade Setup as it would offer another objective entry on a break below the pennant formation. For those unable to short FAS, FAZ (3x short financials ETF) or SKF (2x short financials ETF) might be a suitable substitute should the trade play out as expected (i.e.- a relatively swift, mostly uni-directional move down towards any of those targets) as any price decay would be minimal. Extended periods of back & forth chop is when the leverage really works against these ETFs. Of course, a pure short on XLF is always an option as well. Just make sure to adjust down your position size accordingly if using a leveraged ETF in lieu of a non-leveraged ETF such as XLF.