
XLF (Financial Sector ETF) is likely to spark a new downtrend should prices break below both this extremely well-defined downtrend line (6 reactions) AND the bottom of this triangle pattern. As I still favor considerable downside in US equities in the coming months & the financials still one of my favorite swing short candidates, FAS will trigger short entry on any move below 22.95 in XLF. I chose that level as it lies just below yesterday’s highs & the bottom of today’s gap. Waiting for that level to be taken out vs. shorting a break of the triangle pattern helps reduce the chances of shorting into a false breakdown, should XLF find support on a backfill of today’s gap.
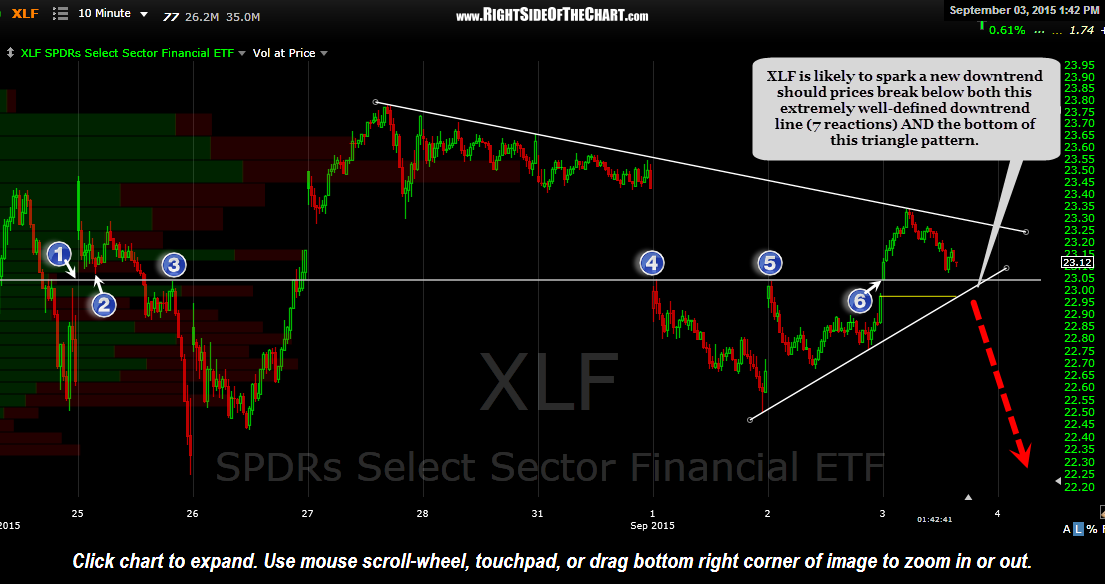
XLF 5 minute Sept 3rd
As with the recent FAS short swing trade, which was closed out a few weeks ago for a 29% gain, shorting FAS in lieu of XLF gives the opportunity to profit from both a drop in the financial sector as well as the price decay suffered by leveraged ETFs, especially when held for extended periods of time. Of course, this pattern could also break to the upside and if so, those bullish might opt to go long XLF on an upside break above this symmetrical triangle pattern (although I will not add an XLF long as an official trade idea at this time).
I should also add that a break of this relatively small pattern (which has only formed over the last week or so on this 5 minute chart) may only be good for a quick trade lasting only a few hours & possibly days as the market has been range bound since the big drop on August 24th. In that case, and XLF short (or any leveraged ETFs such as SKF, FAZ, etc…) might work out to provide a quick trade down to the 22.50 area. Profit targets & suggested stops for the swing trade to follow.