
I had a couple of requests for analysis on XBI (S&P Biotech Sector ETF) and as there are a lot of recent developments in the charts worth noting, I figured that I share my thoughts in a post for those interested. All three charts below are daily time frames.
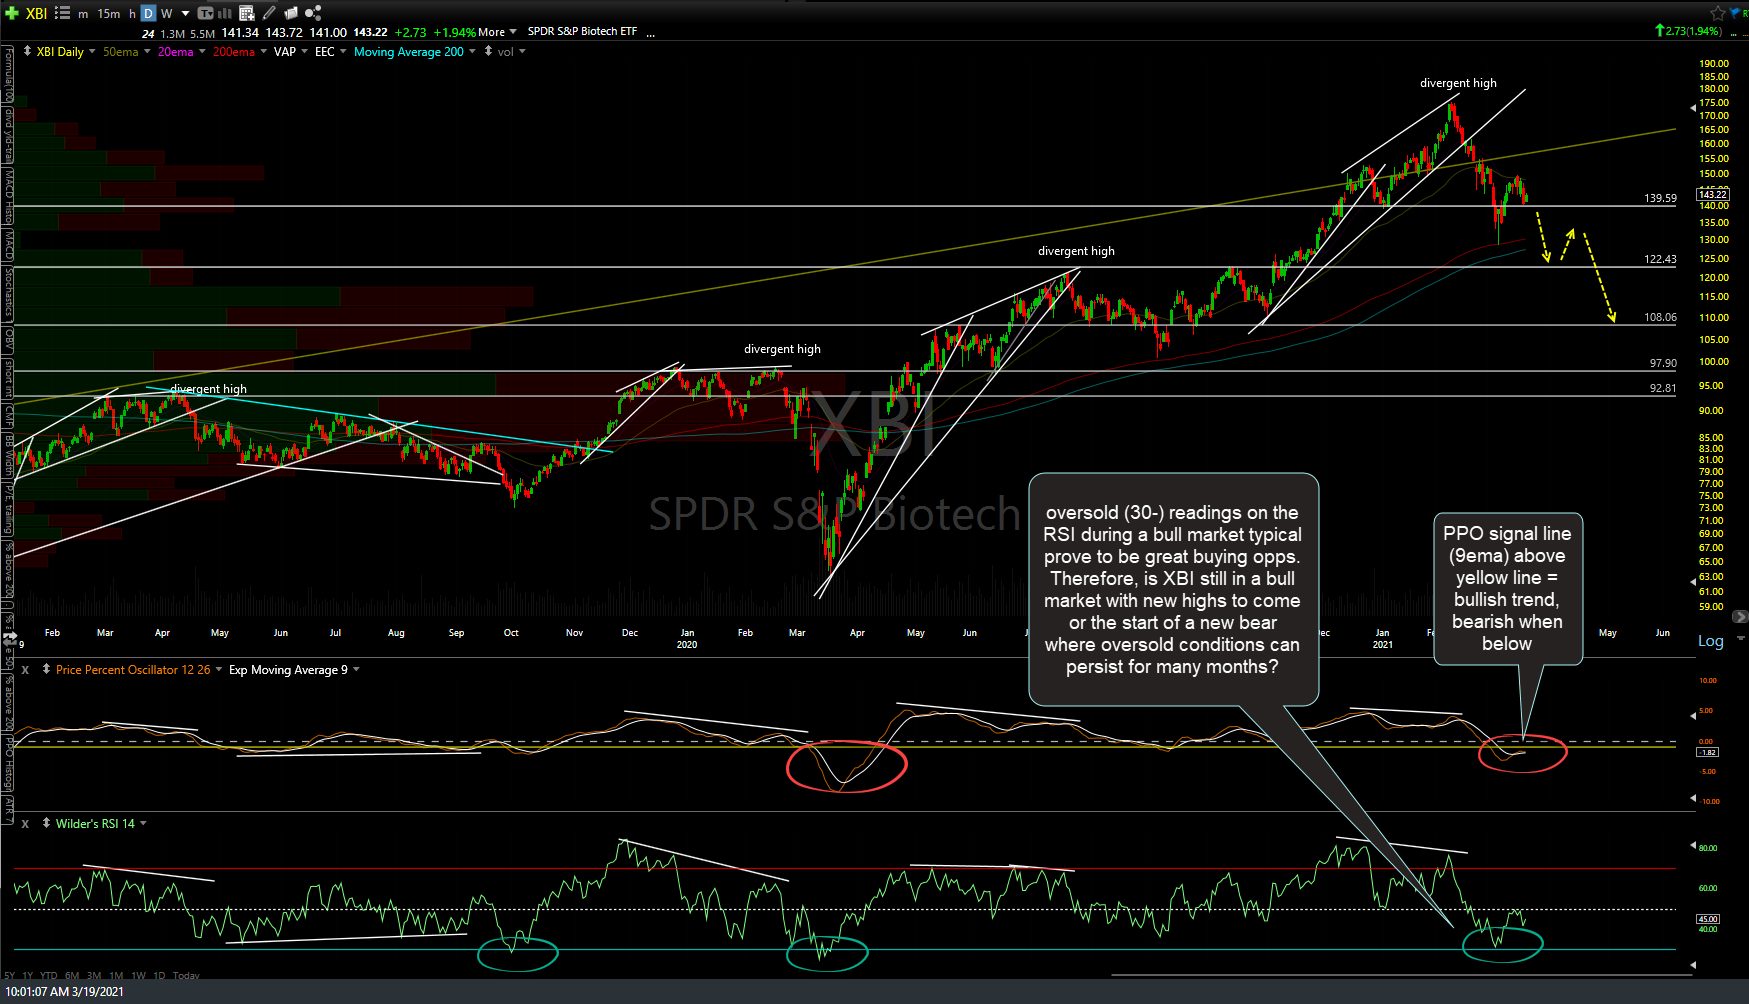
On this first chart below, I see a mixed bag of signals, both bullish & bearish. For the bearish case, XBI put in the most recent divergent high back on February 9th, going on to trigger a sell signal on a break below the uptrend line about a week later on February 17th. The stock made a brief overshoot of the 139.59 support on what appears to be the first counter-trend rally since the correction started. Additional evidence to support another leg down towards the next target(s) shown on this chart is the PPO signal line (9-ema) recently crossing below my yellow bull/bear trend line (set slightly below the zero line on the PPO). When the signal (white) line is above the yellow line, the trend is bullish & bearish when below.
On the flip-side (bullish case), the RSI recent fell to oversold readings (30 or below). Oversold readings on the RSI during a bull market typical prove to be great buying opportunities. Therefore, assuming that the recent drop in XBI was simply a correction within a bull market with new highs still to come, then this may prove to be a nice buying opportunity for investors & trend traders. However, if the February 9th high marked the start of a new bear market, then it is likely that oversold conditions in XBI will persist for months as oversold in a bull market is usually “one-and-done” while oversold conditions in bear markets typically see the RSI at and below the 30 level up to around the 50 level (which was recently hit) for months on end.
XBI daily March 19th
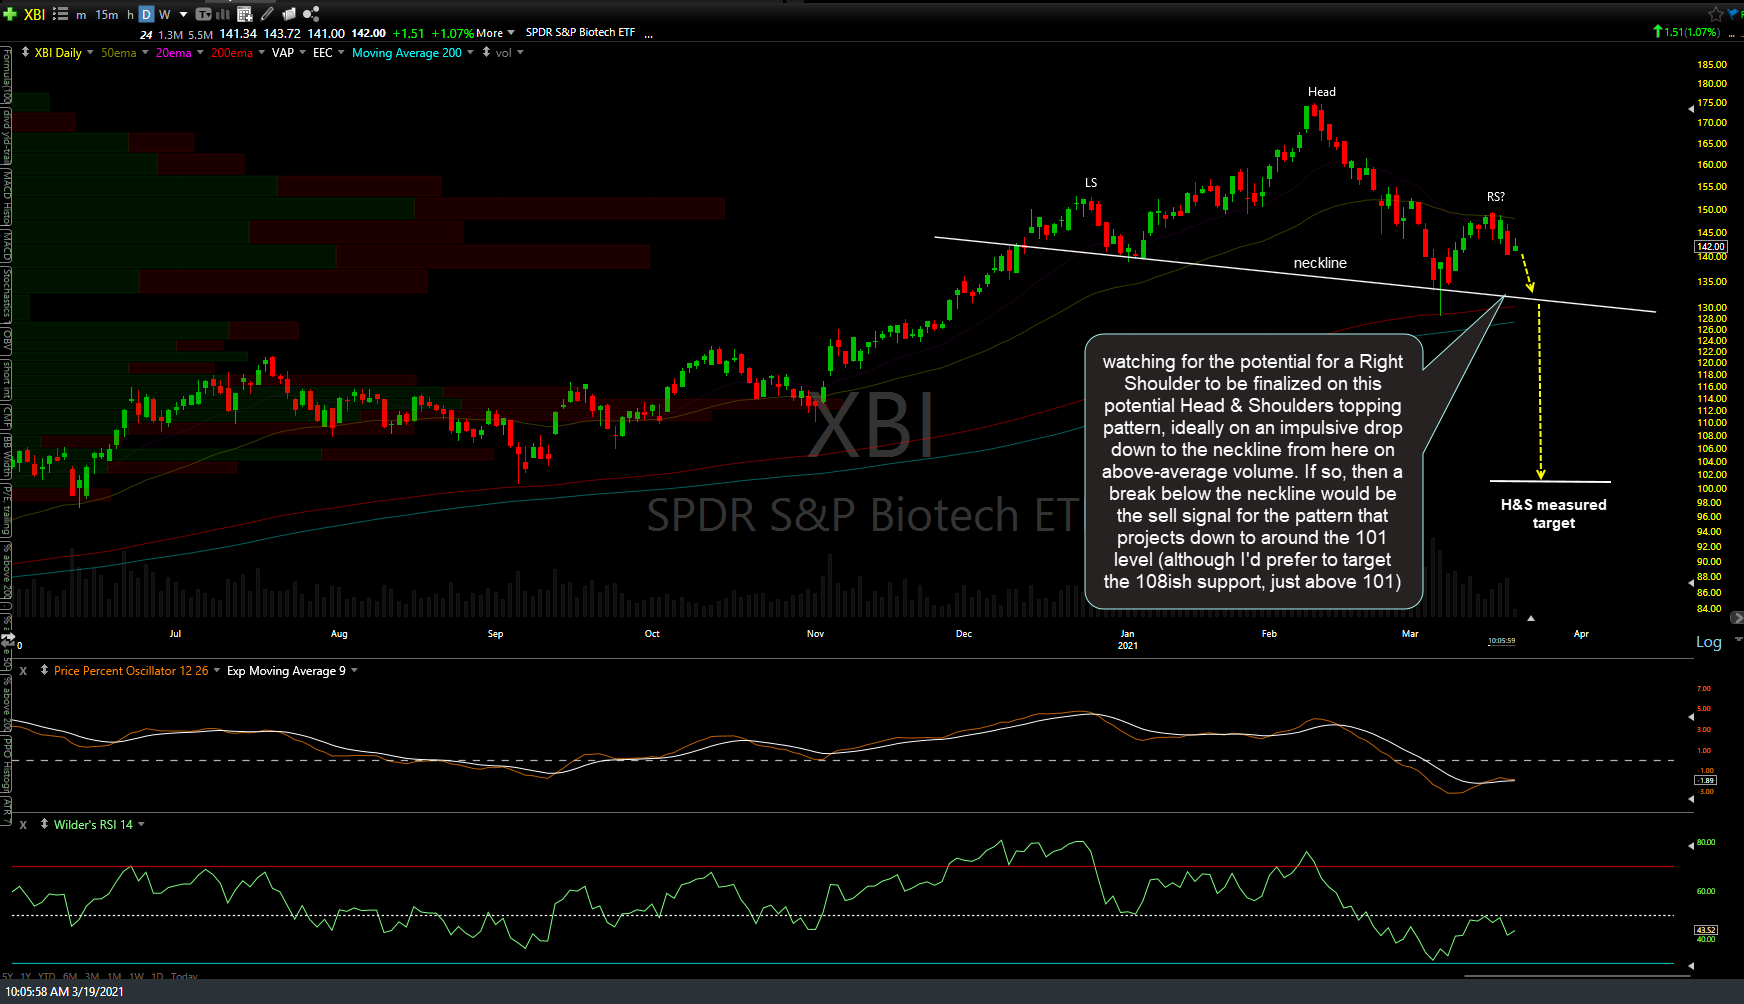
I’ll be watching for the potential for a Right Shoulder to be finalized on what could prove to be a Head & Shoulders topping pattern, ideally on an impulsive drop down to the neckline from here on above-average volume. If so, then a break below the neckline would be the sell signal for the pattern that projects down to around the 101 level (although I’d prefer to target the 108ish support, just above 101).
Keep in mind, this is only a potential bearish chart pattern that has yet to be finalized. If & when finalized (via the completion of a right shoulder), the pattern would trigger a sell signal on a solid break and/or daily close below the neckline. One aggressive strategy, assuming it aligns with your outlook for both the biotech sector as well as the broad market, would be to short a partial position of XBI if/when the indexes trigger another sell signal on a break below yesterday’s lows, with a stop not far above the top of the right shoulder, adding to a full position if/when a sell signal comes on a break below the neckline. Likewise, those bullish on the biotechs & stock market can go long here with stops below the previous reaction low.
XBI daily 3 March 19th
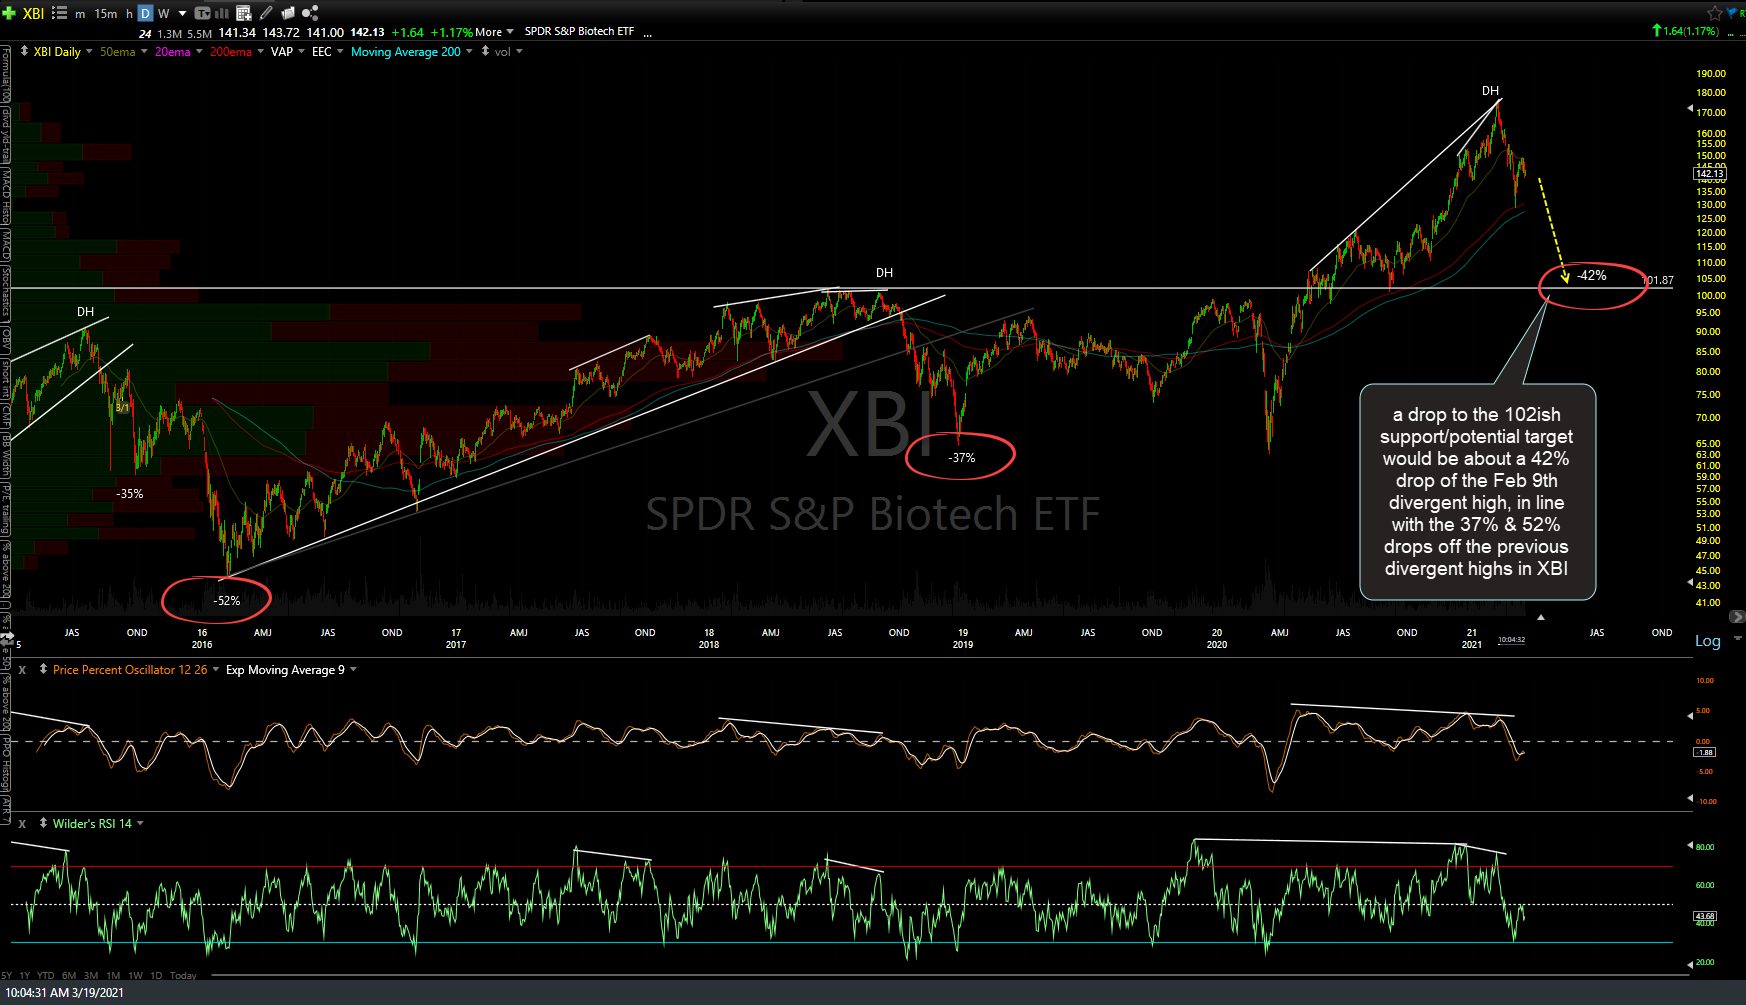
Finally, a drop to the 102ish support/potential target would be about a 42% drop of the Feb 9th divergent high which is in line with the 37% & 52% drops off the previous divergent highs in XBI. LABU is the 3x leveraged ETF that tracks the same biotech sector as XBI with LABD the 3x inverse (bearish) ETF.
XBI daily 2 March 19th