
I continue to monitor the potential Inverse Head & Shoulders Bottoming Pattern that was highlighted recently in the trading room. On watch for a continued move up to the neckline, ideally on above average volume, in order to finalize this potential right shoulder.
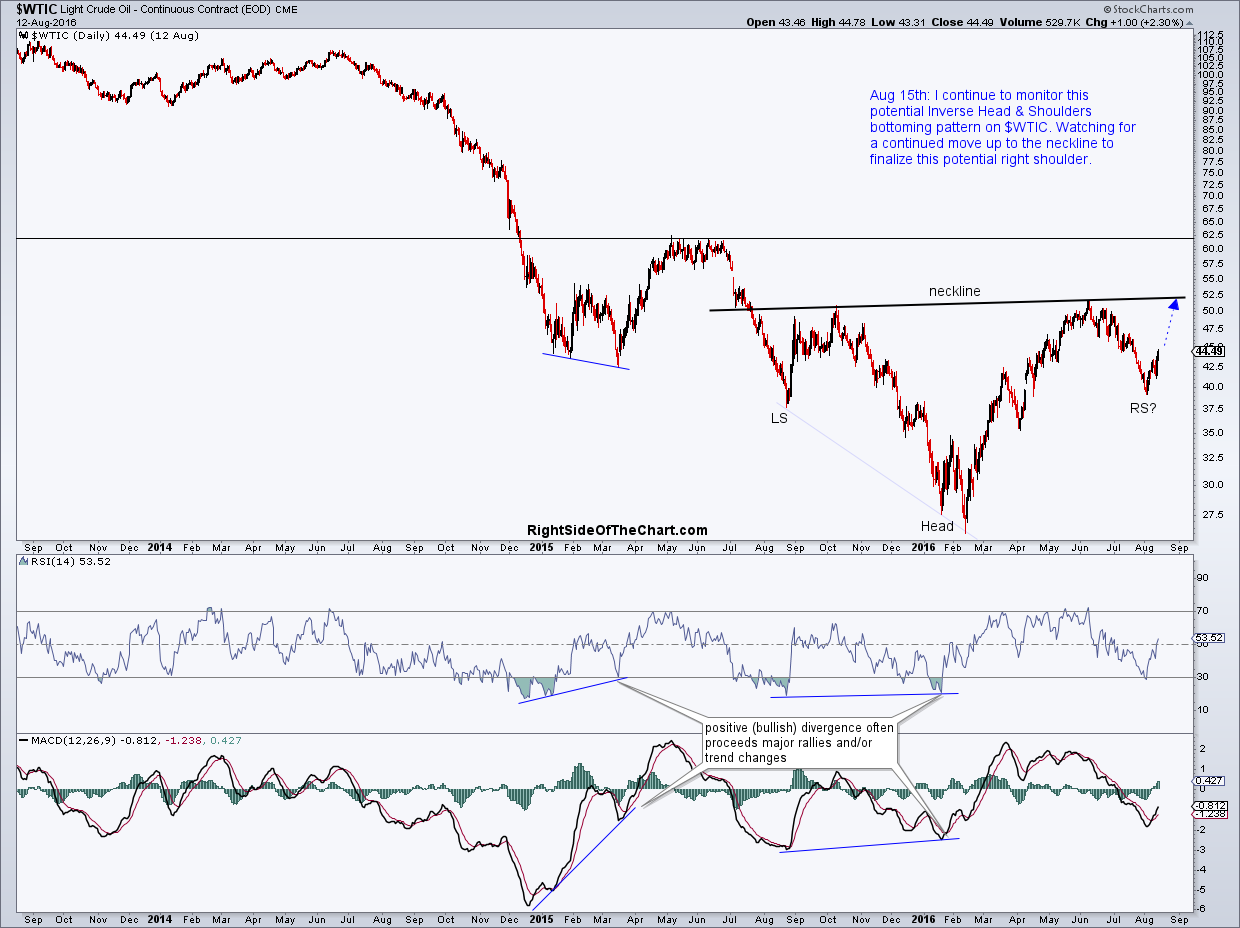
$WTIC daily Aug 15th
Zooming out to the bigger picture, with this 20-year weekly chart of $WTIC, the longer-term bullish case that I’ve maintained throughout 2016 is still very much intact at this point. While a break below the August lows wouldn’t dampen the longer-term bullish outlook, it would likely destroy the symmetry of this IHS bottoming pattern unless it occurred very soon & only slightly undercut the August lows in crude oil.

$WTIC weekly Aug 15th