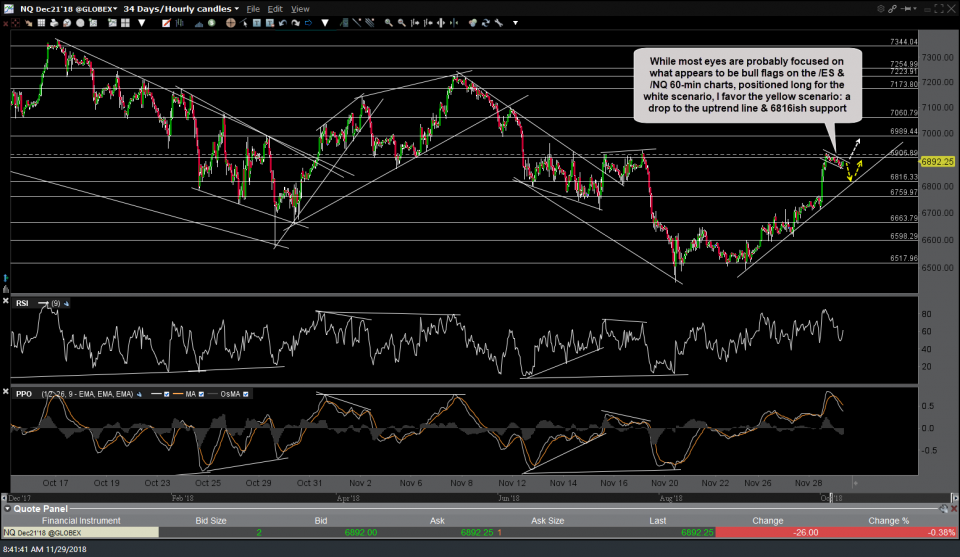
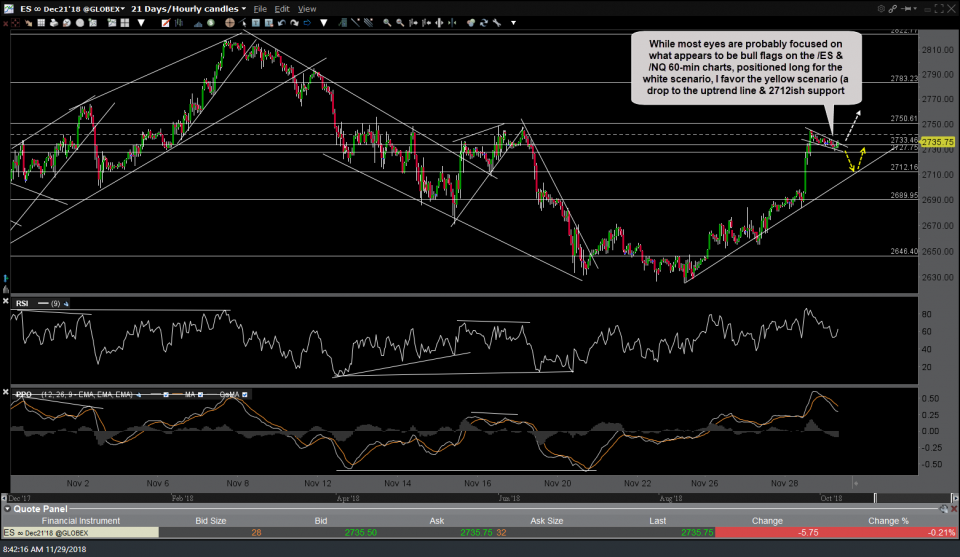
I wanted to share a quick update before the market opened today with the very near-term outlook for the major stock indices. As expected, /NQ (Nasdaq 100 E-mini futures) stopped & reversed right around that 6907 price target/resistance level that it hit on the rally into the close yesterday. From there, both /NQ & /ES (S&P 500 E-mini futures) have drifted back into what appears to be textbook bull flag consolidation patterns. While most eyes are probably focused on what appears to be bull flags on the /ES & /NQ 60-min charts, positioned long for the white scenario, I favor the yellow scenario: a drop to the intersecting uptrend lines & 2712ish support levels on /ES & 6816 on /NQ.
- NQ 60-min Nov 29th
- ES 60-min Nov 29th
click on the charts to expand. once expanded, charts can be panned & zoomed
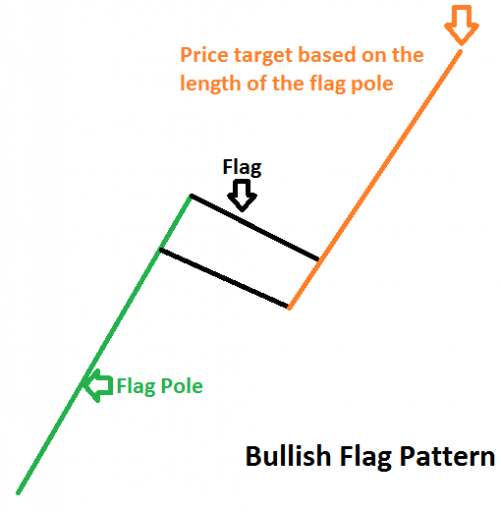
Bull flag patterns are continuation patterns that form following a very sharp, mostly unidirectional advance (aka the flagpole) with the “flag” forming as prices consolidate in a sideways to slightly downwards sloping tight price channel on decreased volume. The buy signal for a bull flag pattern then comes on an impulsive breakout above the flag with the measured target for the pattern being a move equal in length to the distance of the flagpole added to the lowest part of the flag.
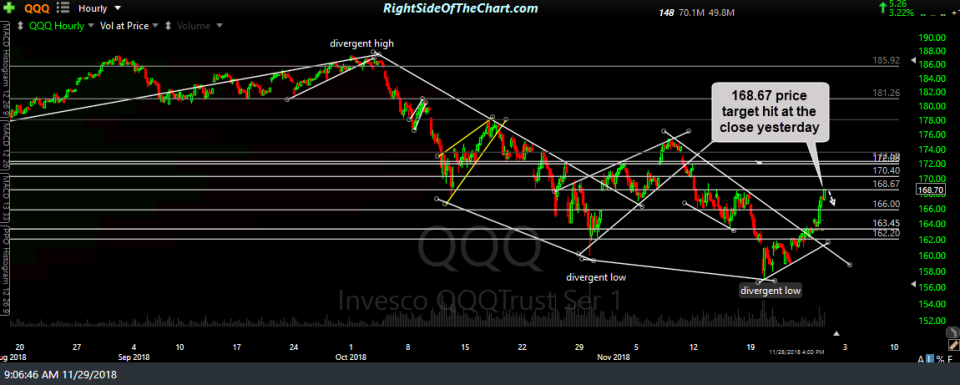
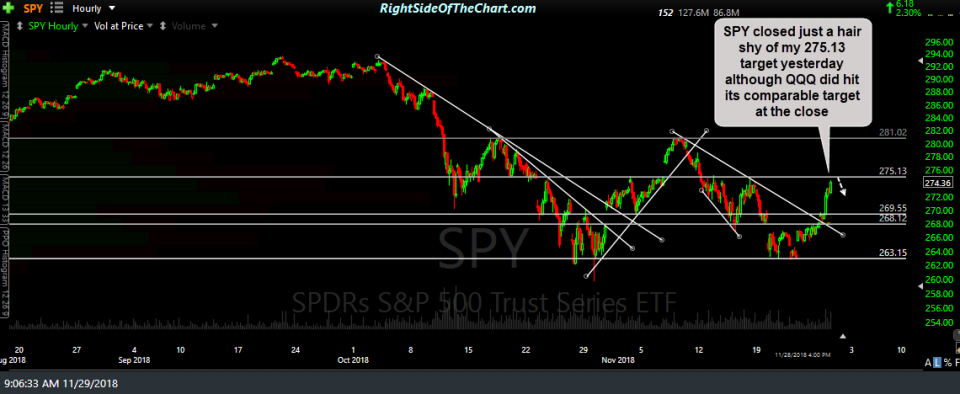
Although there are some other factors that go into my analysis, one of the reasons that I don’t believe that these patterns will play out for another rally roughly equal to the sharp advance leading up to the flags, even if we get a breakout above the flags before or after the markets opens today, is that too many eyes are most likely watching & positioned long for such an obvious (too obvious) pattern. Again, there are other factors that go into my analysis, including by not limited to the key overhead resistance levels on the daily charts that were highlighted in yesterday’s video. With that being said, the market may want to prove me wrong so as always, I will respect a convincing upside breakout with a rally that takes out yesterday’s highs as well as the 275.15ish resistance level/price target which SPY closed just shy of yesterday & still has a decent chance of kissing before a reversal sets in.
- QQQ 60-min Nov 28th close
- SPY 60-min Nov 28th close


