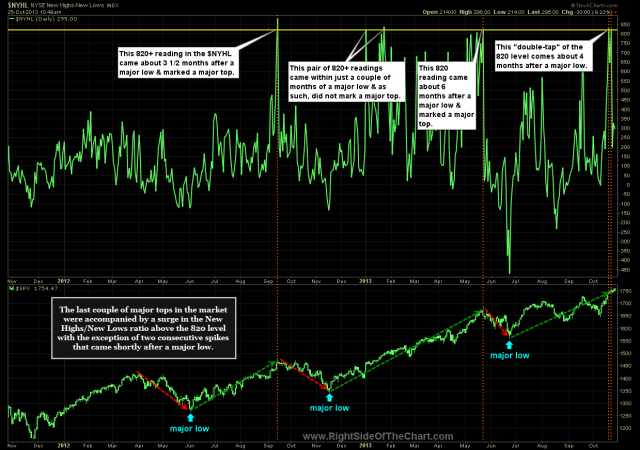
The last couple of major tops in the market were accompanied by a surge in the NYSE New Highs/New Lows ratio above the 820 level with the exception of two consecutive spikes that came shortly after a major low. I will add that these spikes to the 820 level, including the current double-tap of that level, only occurred a few times as shown here. Going back well beyond the last decade the $NYHL ratio never spiked to such levels and therefore, this is a relatively small set of data points yet still worth noting IMO. The take-away from that markets don’t always top on deteriorating breadth as the last few major tops were accompanied by major peaks in the New Highs/New Lows Ratio.
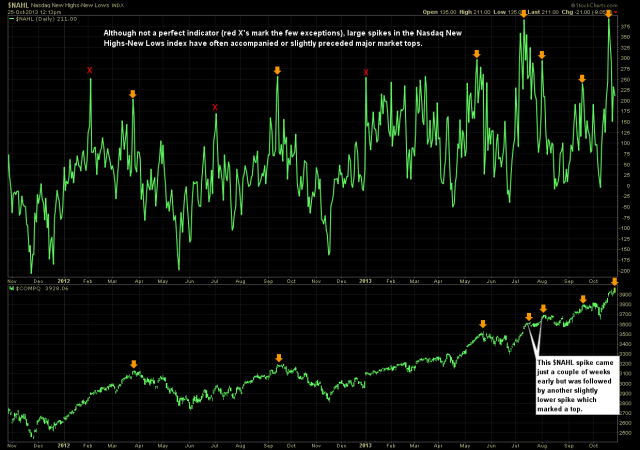
Similarly, the Nasdaq New High-New Lows Index also illustrates that the majority of intermediate-term market tops over the last couple of years have been accompanied or only slightly preceded by large spikes in the New High-New Low ratio. There were a few instances of spike on the ratio that occurred during strong uptrends that were not followed by a correction but that seems to be more the exception than the rule. Only time will tell is these recent spikes in the New Highs-New Lows ratios will prove to be just an insignificant blip in an ongoing uptrend or signal a crescendo of strength in the market just before the next correction begins.


