Member @MattChartier had requested an update on wheat & corn within the trading room and as WEAT (wheat ETN) is an unofficial trade idea, I figured that I would post the update here on the front page for those interested.
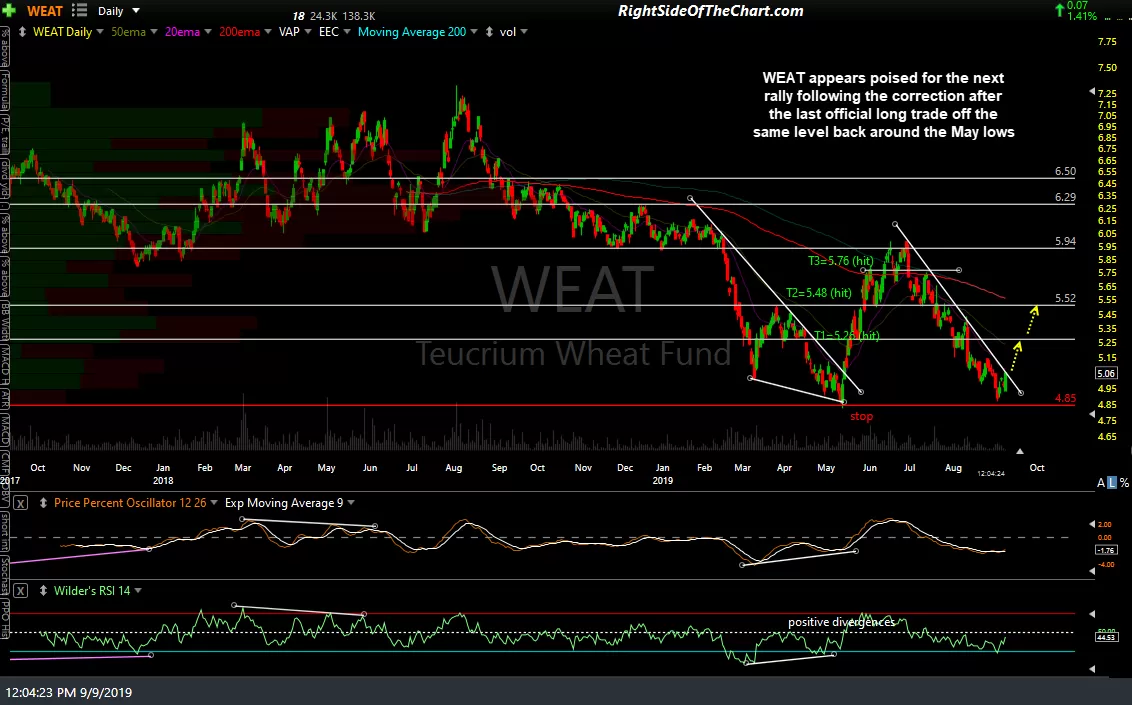
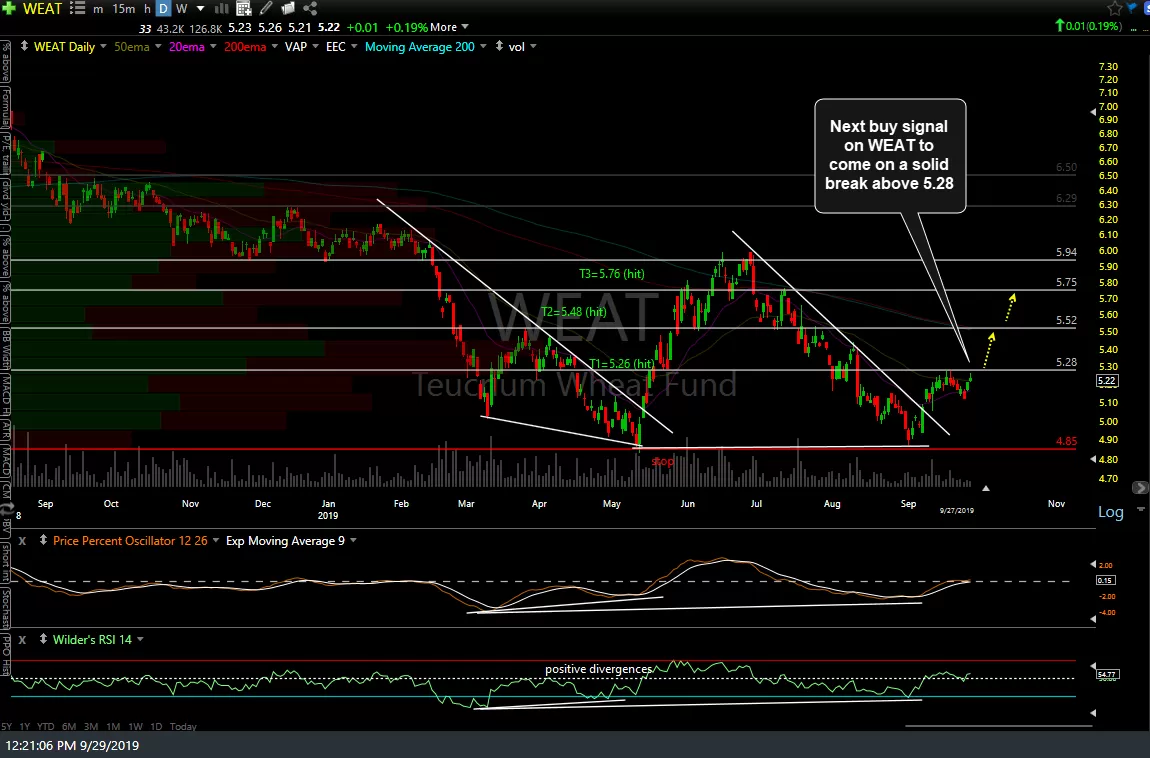
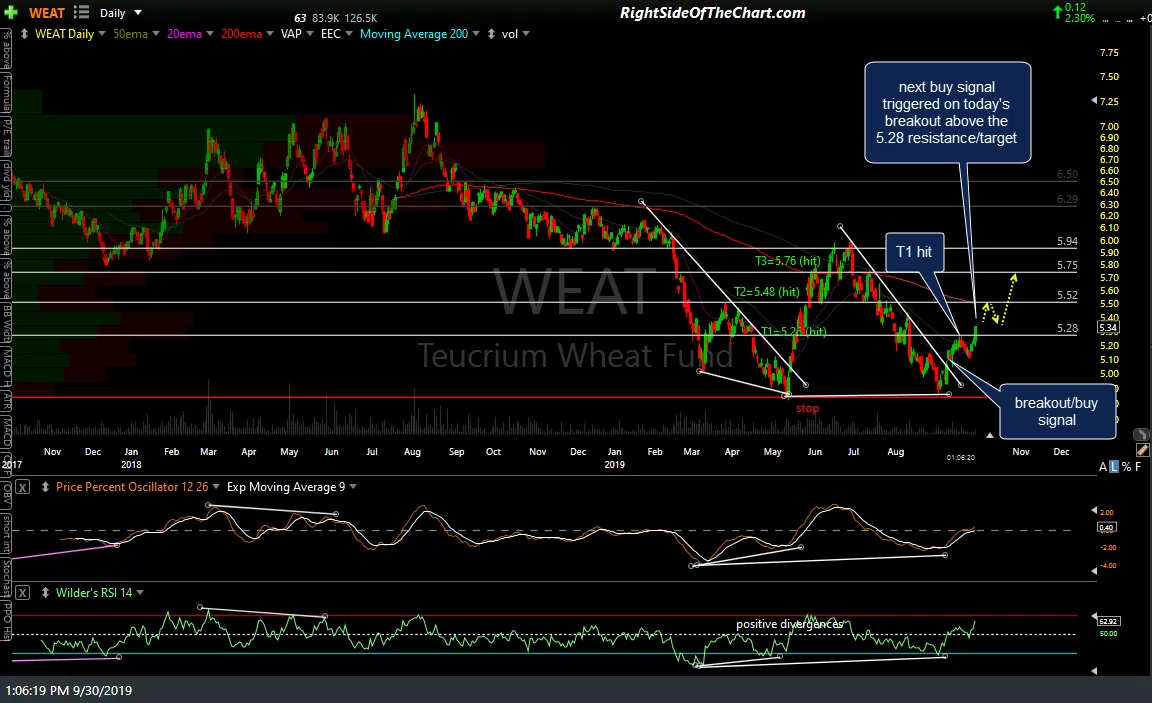
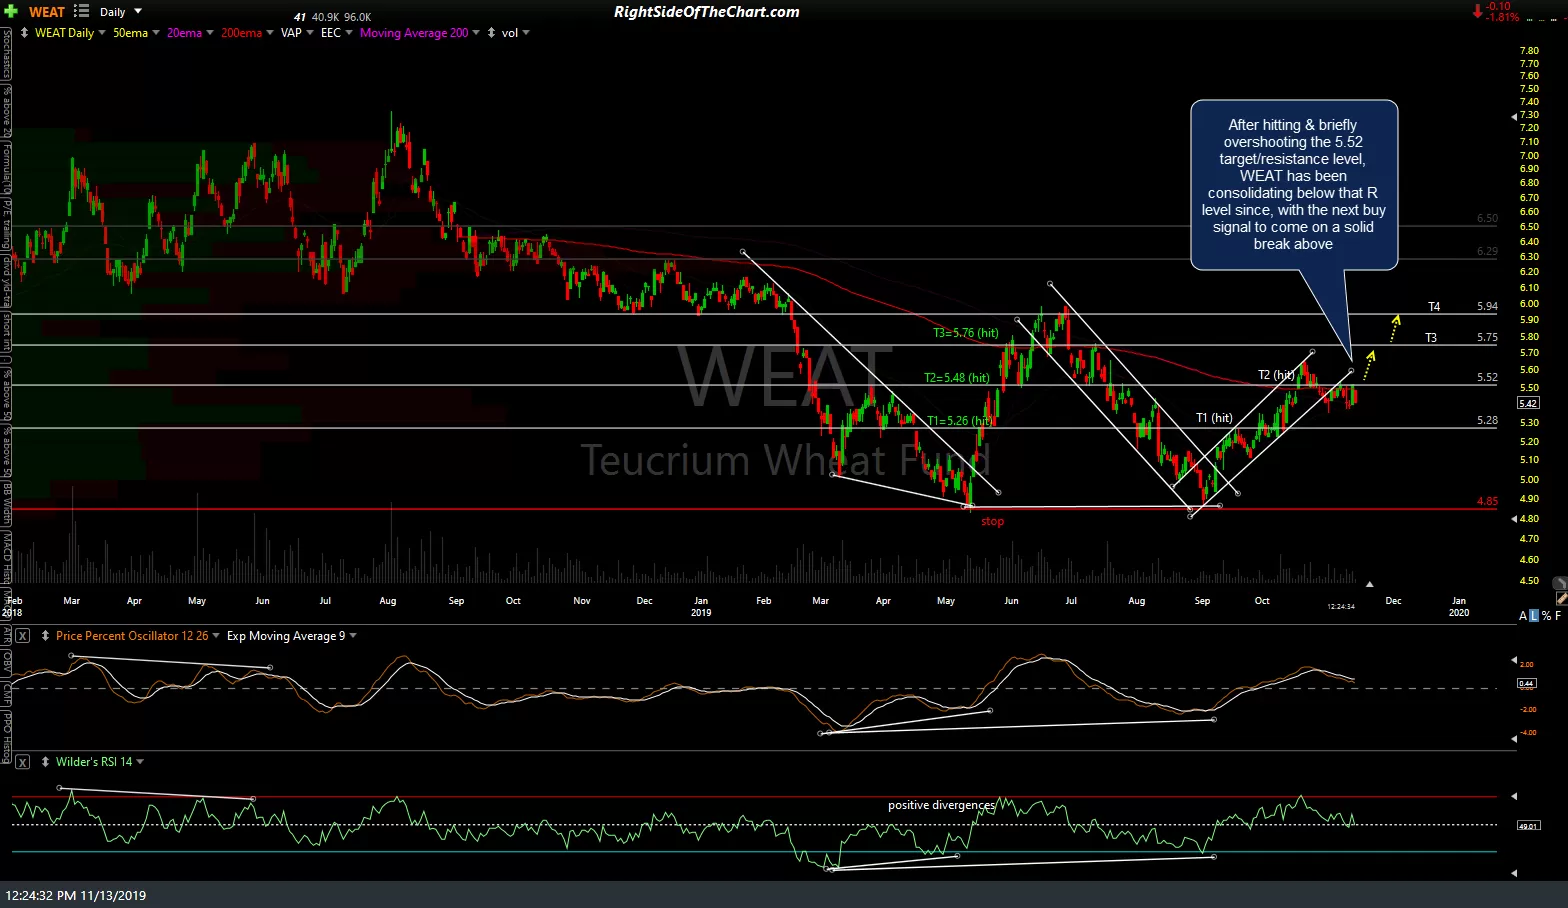
In the first chart below posted just over two months ago on Sept 9th, WEAT was poised to break out above the downtrend line off the June 28th highs were the previous rally off the May lows ended shortly after the final target (T3) from that official trade was hit. WEAT went on to break out above that trendline from there hitting both the first (5.28) & second (5.52) targets and after hitting & briefly overshooting the 5.52 target/resistance level, WEAT has been consolidating below that R level since with the next buy signal to come on a solid break above.
click on the first chart to expand. Once expanded, the charts can be panned & zoomed for additional detail.
-
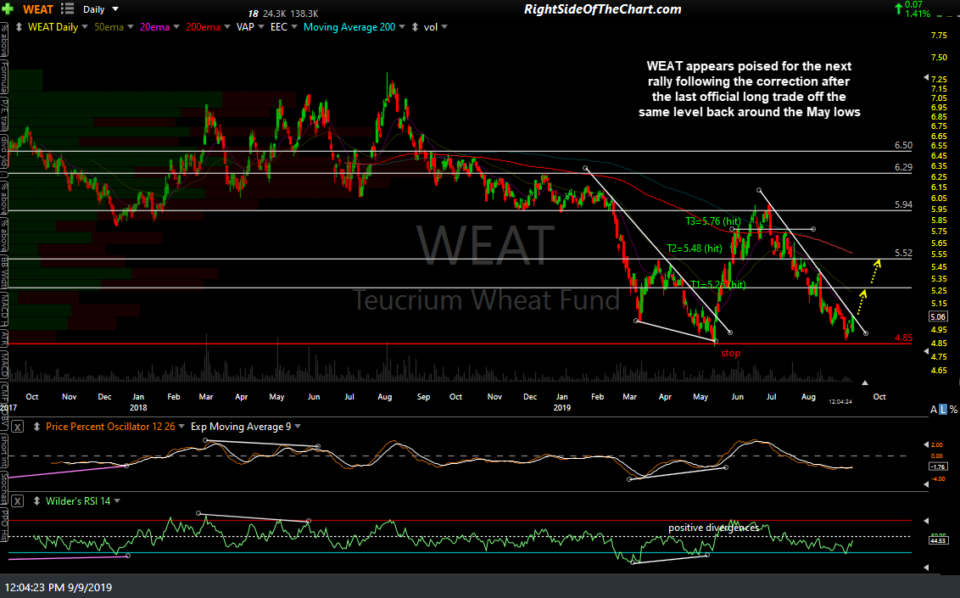
- WEAT daily Sept 9th
-
- WEAT daily Sept 29th
-
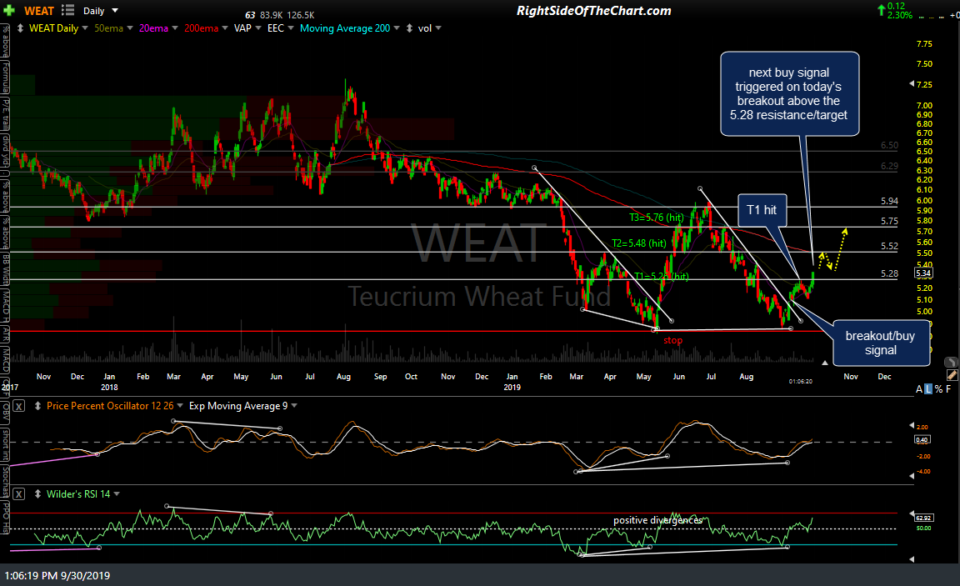
- WEAT daily Sept 30th
-
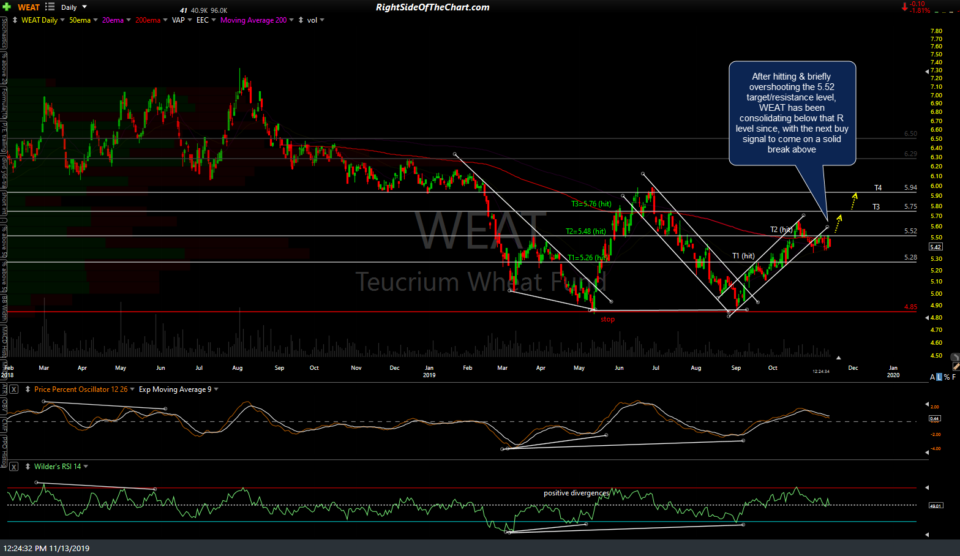
- WEAT daily Nov 13th
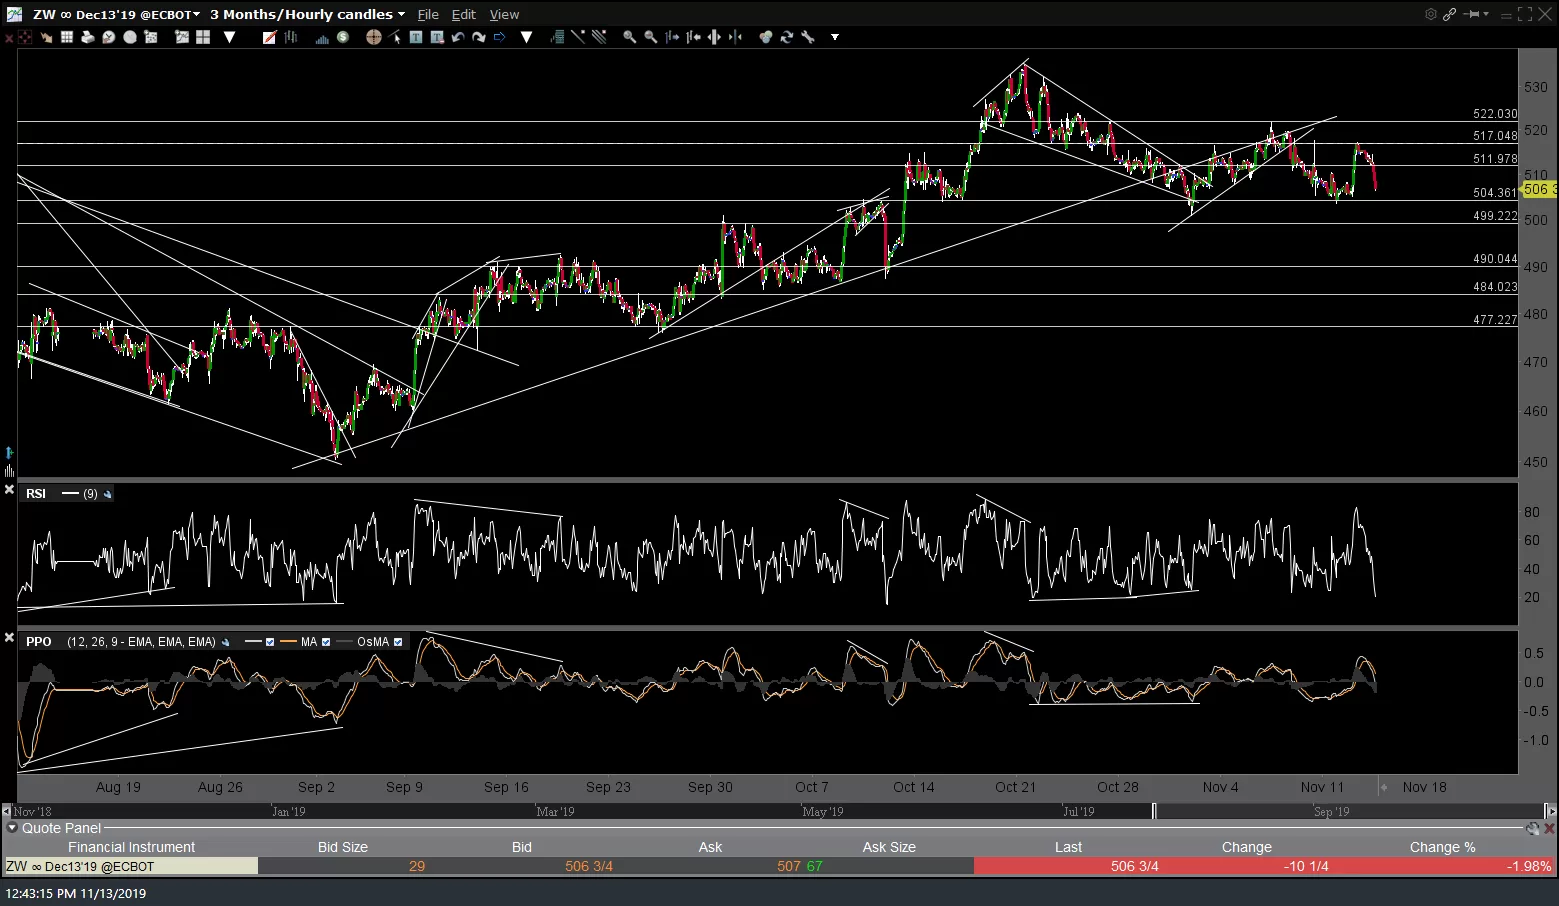
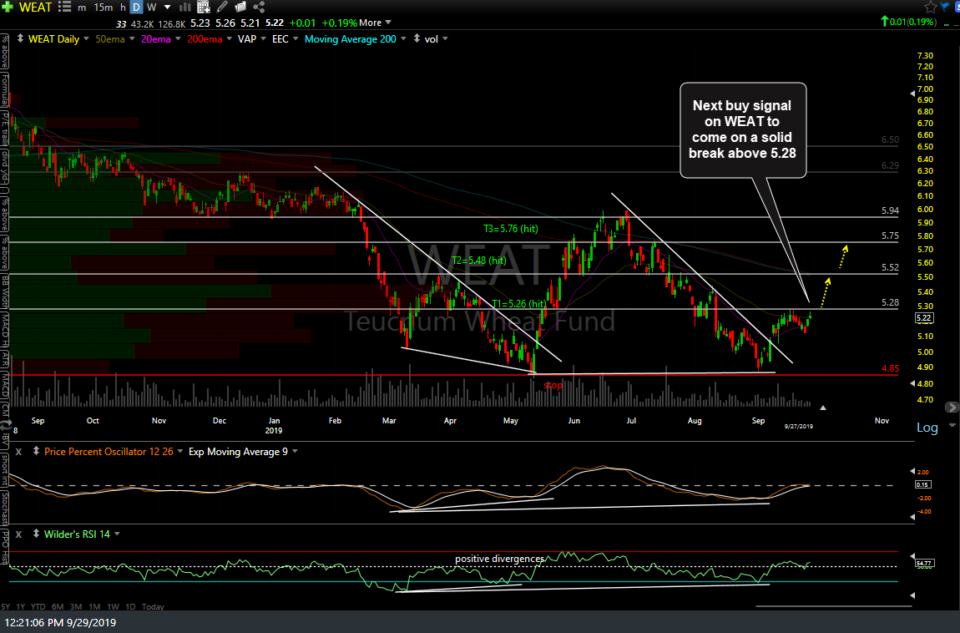
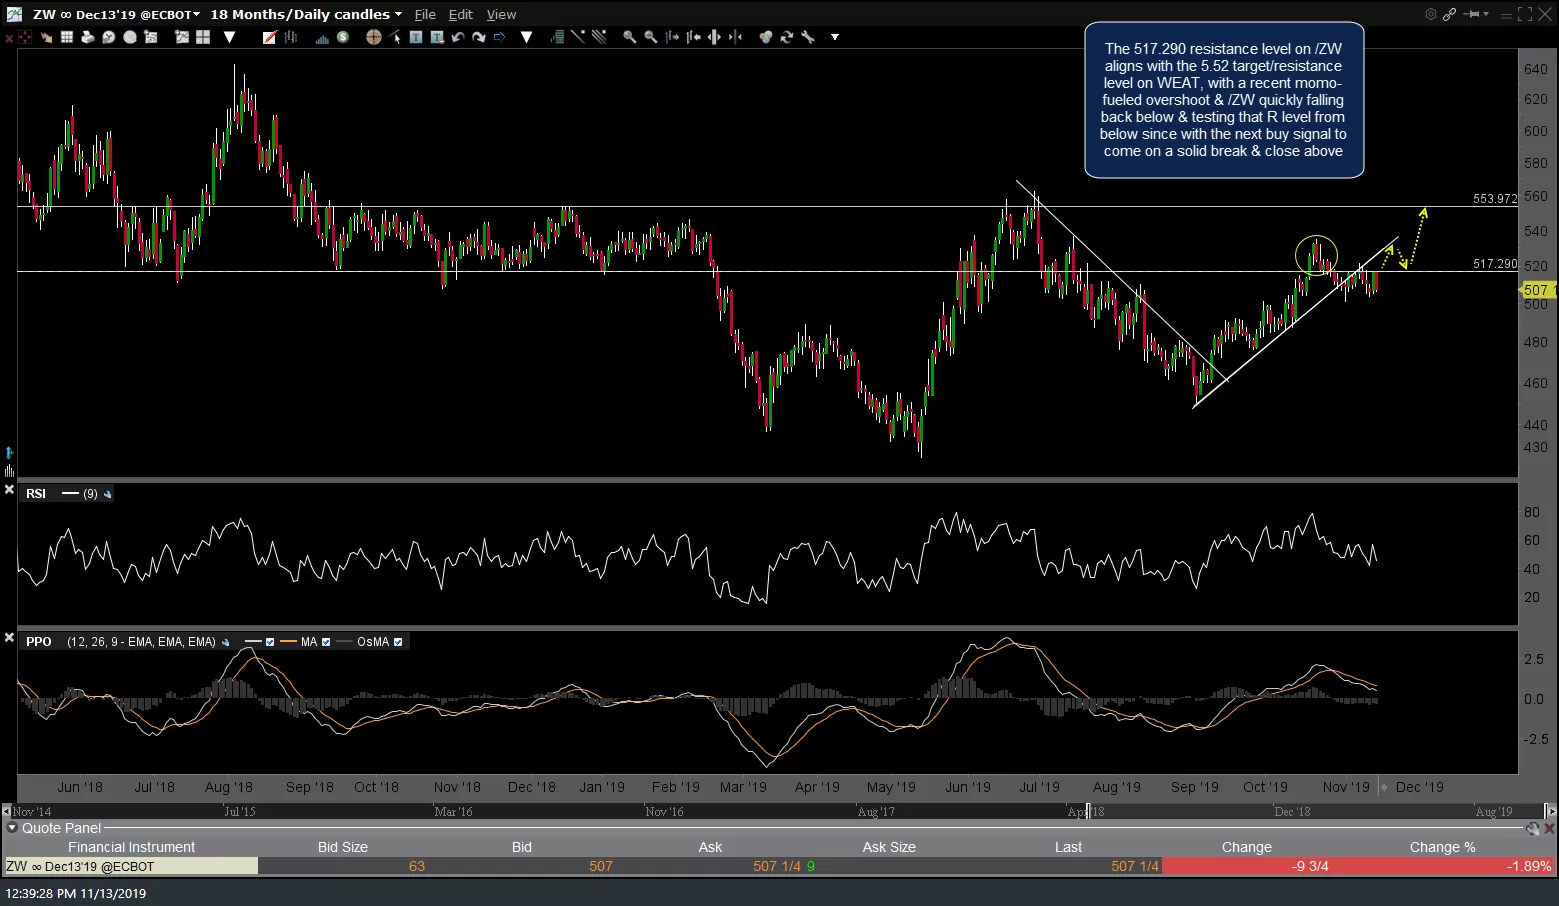
The 517.290 resistance level on /ZW (wheat futures) aligns with the 5.52 target/resistance level on WEAT, with a recent momo-fueled overshoot & /ZW quickly falling back below & testing that resistance level from below since with the next buy signal to come on a solid break & close above (as shown on 1st chart, daily time frame, below). I’ve also included a 60-minute chart of /ZW with some support & resistance levels that active trader might find useful.
-

- /ZW daily Nov 13th
-

- /ZW 60m Nov 13th