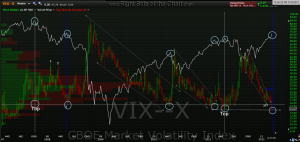
here’s a weekly view of the VIX (candlesticks) vs. the SPX (solid line). disregard my other annotations for now and just focus on the circles which show what happened to the SPX every time the VIX fell to this key support area.
trading is not an exact science nor is it rocket science either. what i mean by that is there are times when one enough red flags (or even green lights on the flip-side for that matter) that warrant extreme caution (or aggressive buying). yes, anyone who has been overly cautious or bearish for the last month or so has eaten a plate full of crow and/or missed out on some nice long-side gains. however, just because one chooses to ignore these risks does not mean that they were not/are not valid. those who ignore history are often doomed to repeat it and even a quick glance at this multi-year VIX chart shows how the market has performed following periods where the VIX fell from much higher levels down to the current level. does that mean that the market MUST follow the same course of action this time around? of course not. does that mean that the probability of a significant correction is well above average right now? in my opinion, based on this chart as well as a myriad of other factors, yes.
however, that also means that unless you are a very nimble and experienced traders, you can’t just go shorting the market blindly with both fists. the problem with many key market reversals or corrections is that some of the biggest gains often come just before the top. this market has been very tricky lately as well, giving many clear sell signals that have been quickly negated and usually in a very rapid fashion and there’s no way to know when that pattern will end but what we do know is that with each tick higher in the market, bullish complacency increases and bearish capitulation increases.
there are many options for a trader or investor right now: continue to play the long-side, while trailing stops higher, as long as the momentum continues… go to cash and wait for either a clear sell-signal to trade the short-side or accumulate shares long at more favorable prices on a pullback…. trade a long/short hedge portfolio with the best patterns of both long and short ideas, etc… many choices exist but one of the worst strategies IMO would be for someone who has been on the sidelines since the Q3 sell-off to start buying longs at this point. it’s one thing to let your profits run, with stops in place, if already long but to start buying at this level is the antithesis of objective trading/investing but that is JMHO. i plan to post new set-ups hopefully this evening, both long and short as market analysis is sort of a “enjoyable pastime” for me but it is the trade ideas, which have clear entry and exit points, that are the primary focus of this site.


