
Following the recent bullish falling wedge breakout & backtest, /VIX (Jan $VIX futures contract) appears poised to run on a solid break above this resistance zone with price targets shown at arrow breaks on the 60-minute chart below.
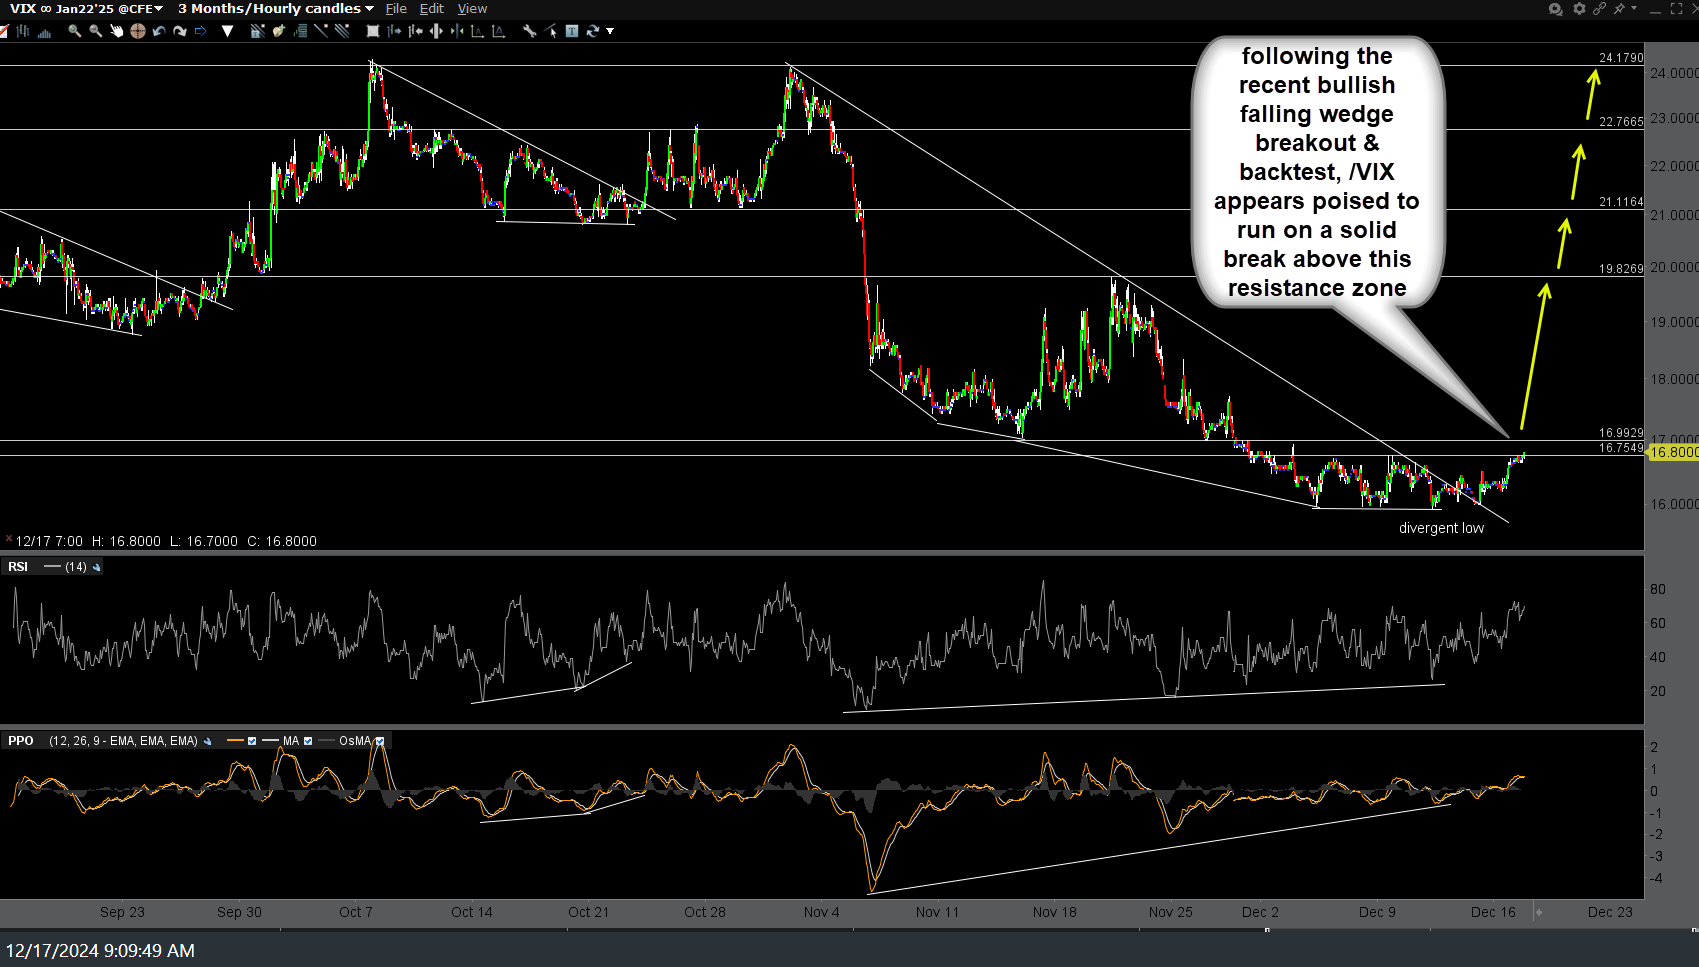
VIX 60m Dec 17th
VIXY previous (Dec 10th) & updated 60-minute charts below for those that prefer ETFs over futures.

VIXY 60m Dec 10th
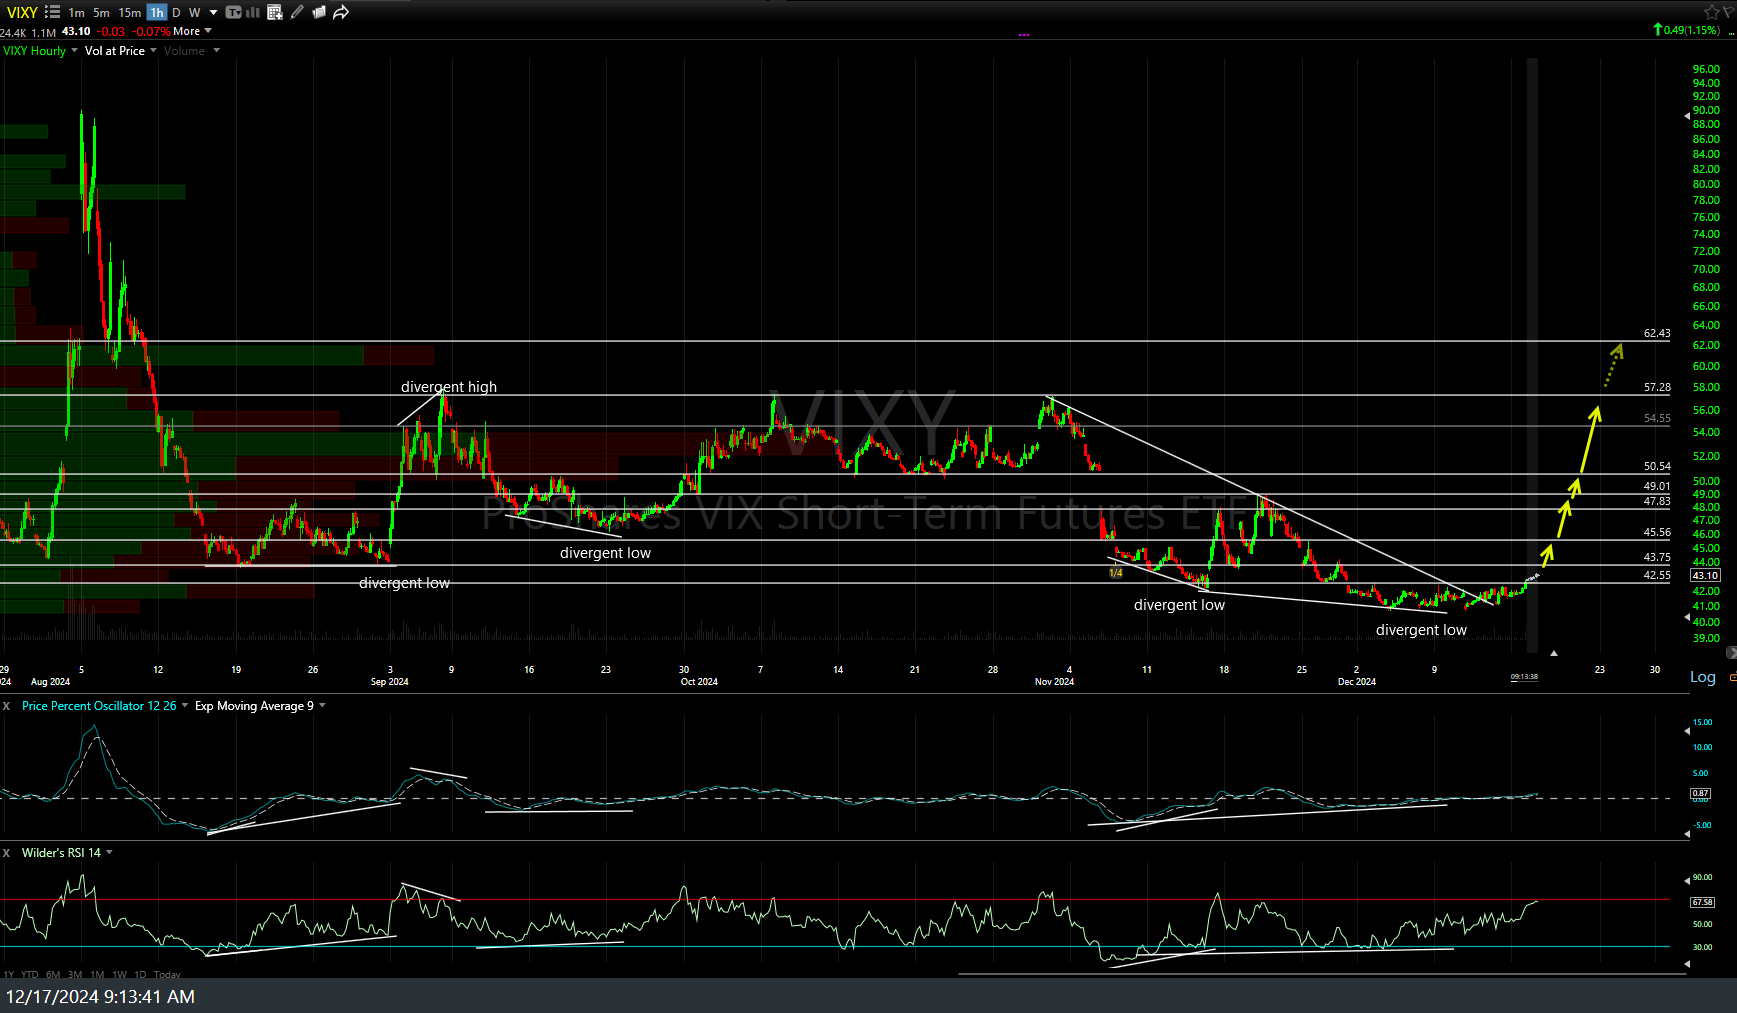
VIXY 60m Dec 17th
For those interested, click here to view an interesting article from Barron’s (subscription/log-in might be required) regarding some of the unusual disconnects & poor internals in the stock market recently. A few excerpts below:
- the S&P 500 rose to just 0.3% off its all-time high at the same time as it extended its streak of negative breadth—more stocks falling than rising—to an 11th day. That hasn’t happened since Dow Jones Market Data records began in 1999
- The other takeaway from all the ambiguity is that the majority of stocks are struggling. The S&P 500 Equal Weight Index, which assigns each stock the same weighting, has fallen in 10 of the 11 trading days in December.
- The 10-year Treasury yield rose to 4.4%, higher than it was before the Federal Reserve’s first interest-rate cut of the current cycle in September—even as traders expect another cut Wednesday
On an admin note, I have a couple of appointments away from my desk today & won’t be back until after lunch time. I will reply to any questions or chart requests after I return. Also, keep in mind the FOMC rate decision is 2pm today followed by Powell’s press conference at 2:30 pm EST. If the bullish setup on the $VIX is going to materialize, a negative reaction to what the Fed does or says today could certainly be a potential catalyst.