
@mmazorra brought to my attention that the dual charts I covered in yesterday’s video, highlighting the stock market corrections that have always followed when USO (crude oil ETN) entered my ORANGE ZONE from below, had mistakenly included USO in both charts instead of USO & QQQ (thanks for pointing that out).
As I had to leave town after posting that video, here’s the updated chart with USO & QQQ, highlighting how, without fail, every move up into the ORANGE ZONE for the last several years was nearly immediately followed by a tradable correction or the next leg down in the 2022 bear market.
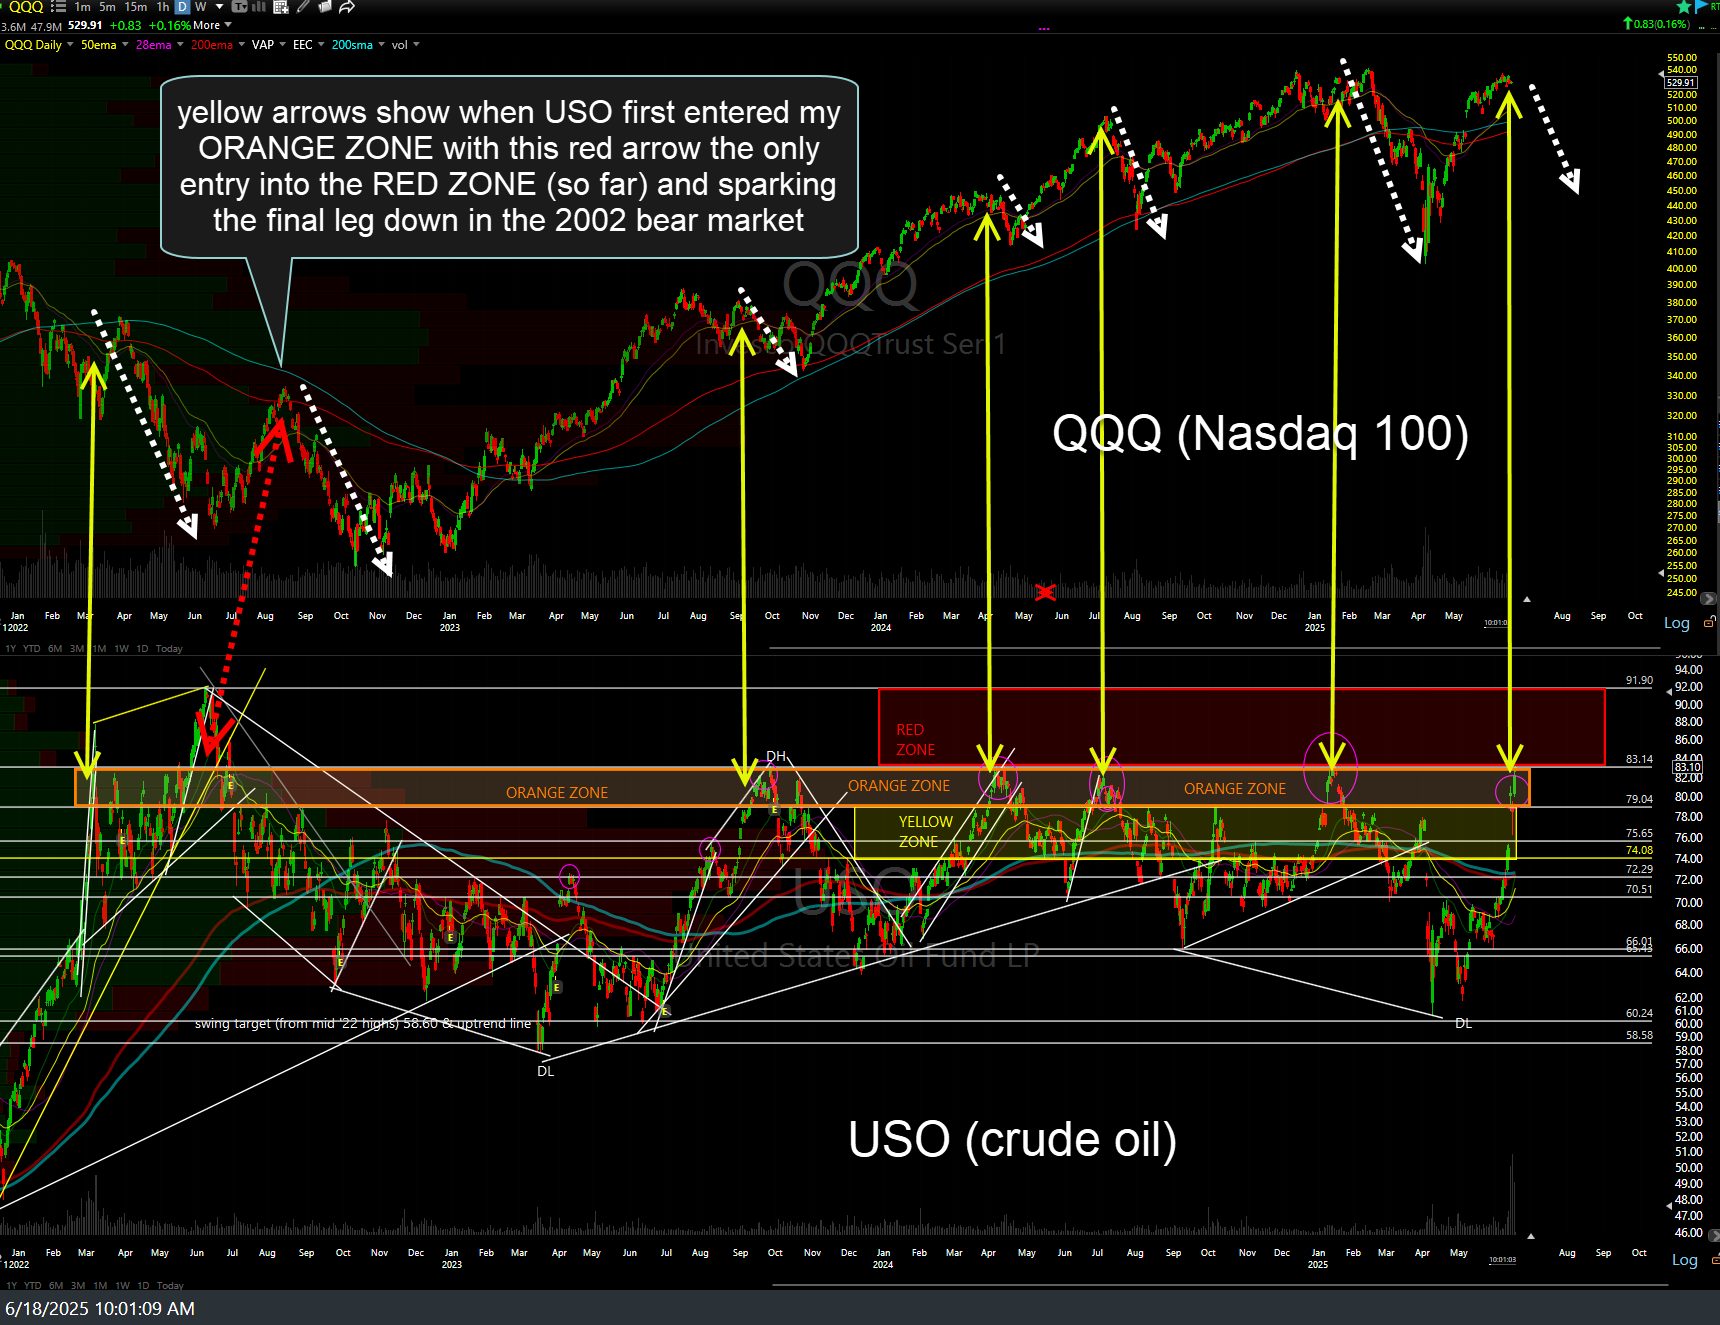
USO Orange Zone History June 18th
Will this time be different? As I like to say: “I only trade in probabilities, not possibilities, as anything is possible.” Therefore, only time will tell.
As always, the impact of high crude oil prices is a function of both how HIGH they go (how deep into the ORANGE or RED zones) and how LONG prices remain elevated in the ORANGE ZONE. As of now, we’re only just starting the third trading session (out of the last four) in the ORANGE ZONE so let’s see how crude continues to trade today & through the remainder of the week.