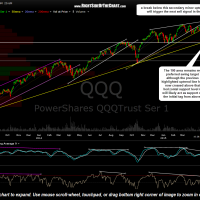
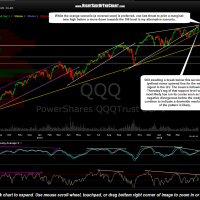
Still awaiting a break below this secondary (yellow) minor uptrend line for the next signal in the Q’s on the daily time frame (the April 30th & today’s updated daily charts below). The bounce following Thursday’s tag of that support level will most likely have run its course soon as the negative divergences below the wedge continue to indicate a downside resolution of the pattern is likely. While the orange scenario (a reversal soon) is preferred, one last thrust to print a marginal new high before a move down towards the 100 level is my alternative scenario.
- QQQ daily April 30th
- QQQ daily May 4th
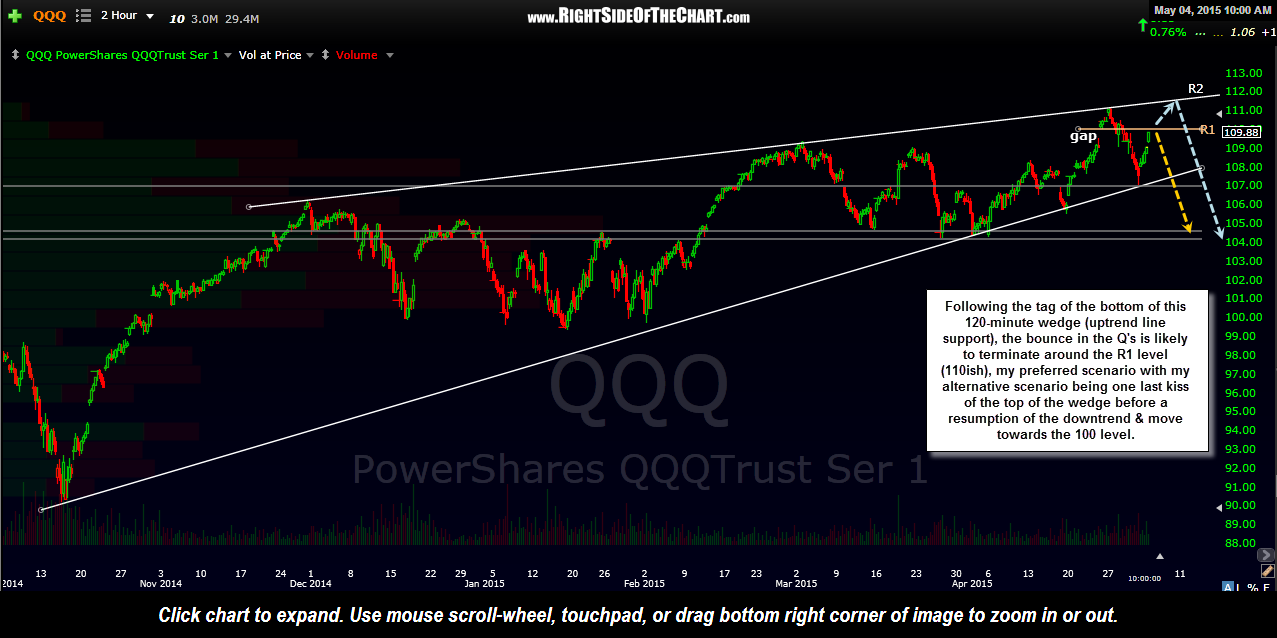
Zooming down to a 2-hour period time frame, I’ve marked my primary (orange) & alternative (blue) scenarios. My primary scenario has QQQ turning down around the 110 area, which is resistance defined by the top of the April 24th gap & slightly above the 61.8% Fibonacci retracement of the recent thrust lower while my alternative scenario would allow for a marginal new high with one more tag (or very slight overshoot) of the top of the wedge pattern.
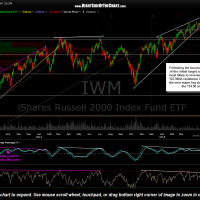
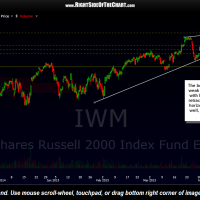
Following the bounce off the top of the initial target zone, IWM is most likely to reverse around the 123.50ish resistance level before the next major leg down towards the 114.50 area (daily chart below). Zooming down to a 2-hour period chart, we can see that the bounce in the small caps has been weak relative to the large cap indices, with IWM only reaching the 38.2% Fib retracement level so far. IWM also has horizontal resistance just overhead as well, making this an objective add-on or new short entry level.
- IWM daily May 4th
- IWM 2-hour May 4th
As with all US equity indices, the negative divergences that have been building while prices rise within the wedge are still well intact & only continue to grow larger, indicating that the SPY/$SPX is still likely to break down below its bearish rising wedge & move considerably lower in the coming weeks/months. Although a marginal new high is certainly a possibility, the SPY has been struggling to break above the 212.40ish level (orange line).


