
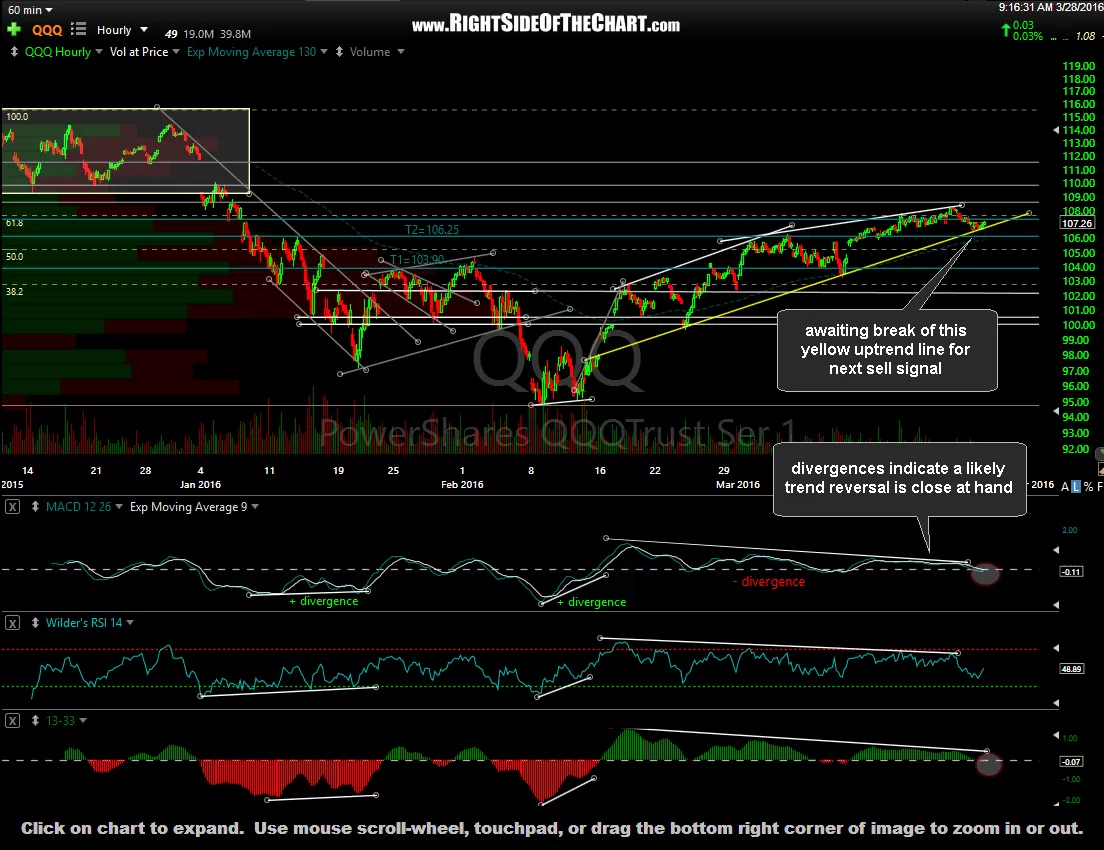
Nothing much has changed in the technical picture for the US equity markets since last week. The longer-term trend, by nearly all metrics, still remains bearish while the near-term trend is still bullish with few early signs of a reversal although a little more downside is needed in order trigger some more significant sell signals, such a below below the yellow downtrend line on the QQQ 60-minute chart below. Here’s a mixed bag of charts on various US indices on both long & short-term time frames:
-
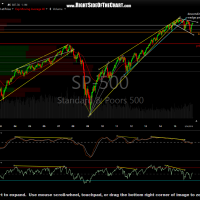
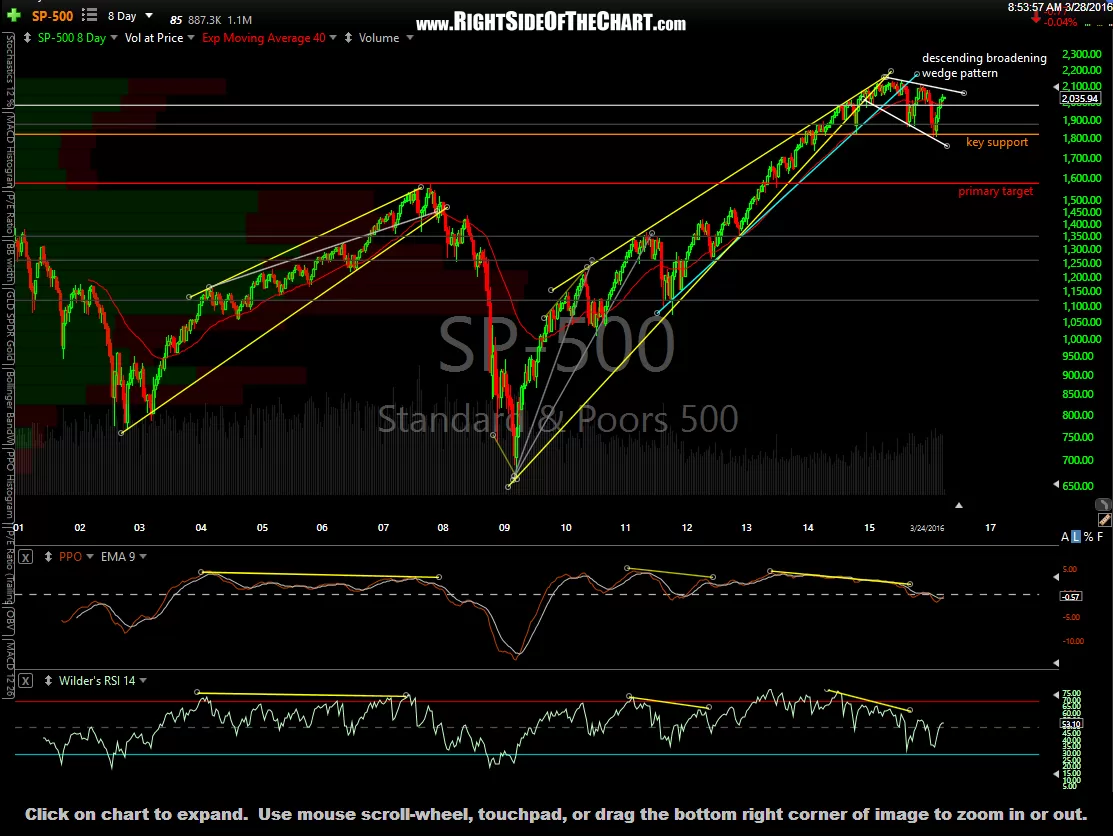
- $SPX 8-d period15-yr March 28th
-
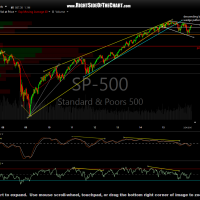
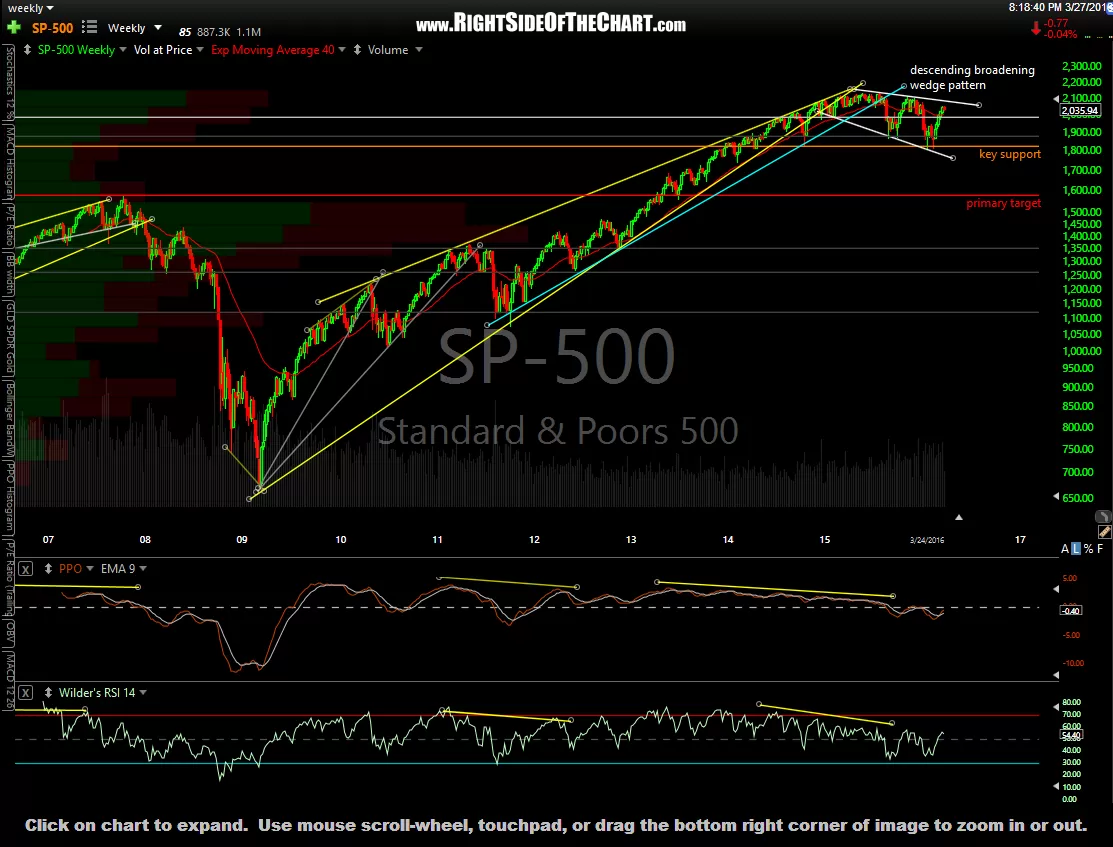
- $SPX weekly March 28th
-
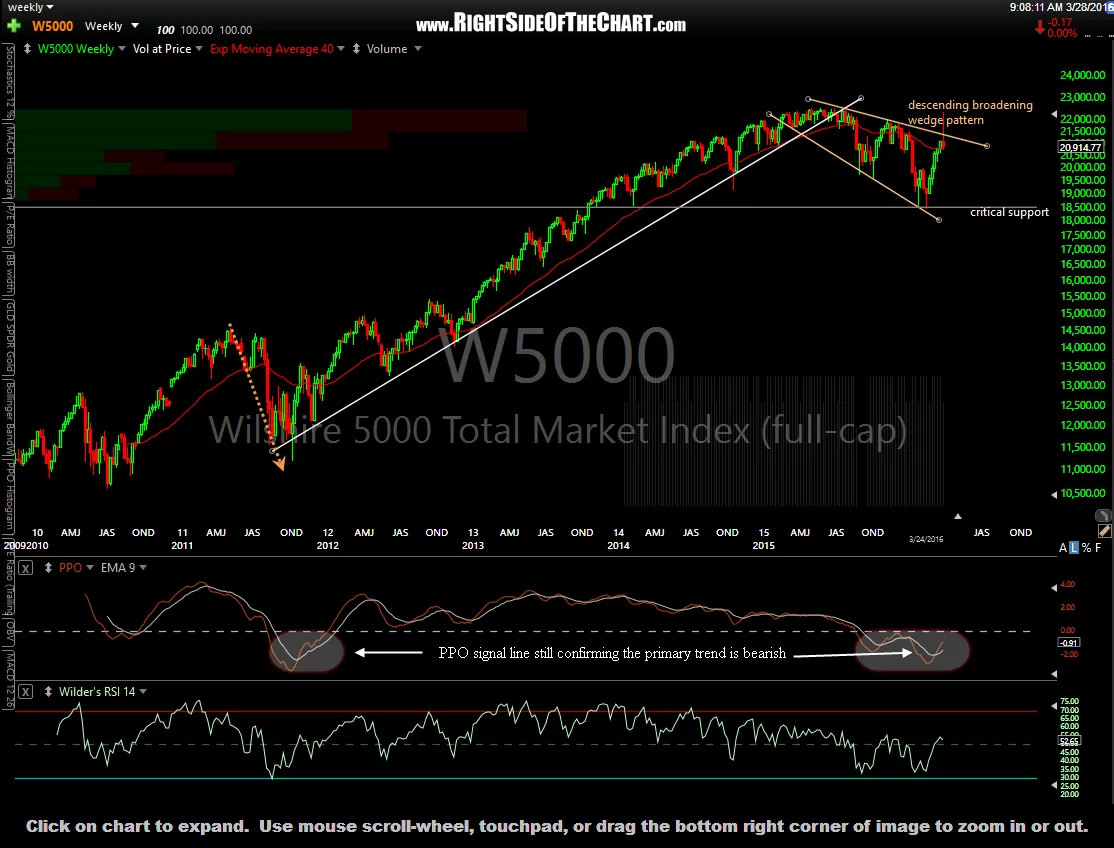
- $WLSH weekly March 28th
-

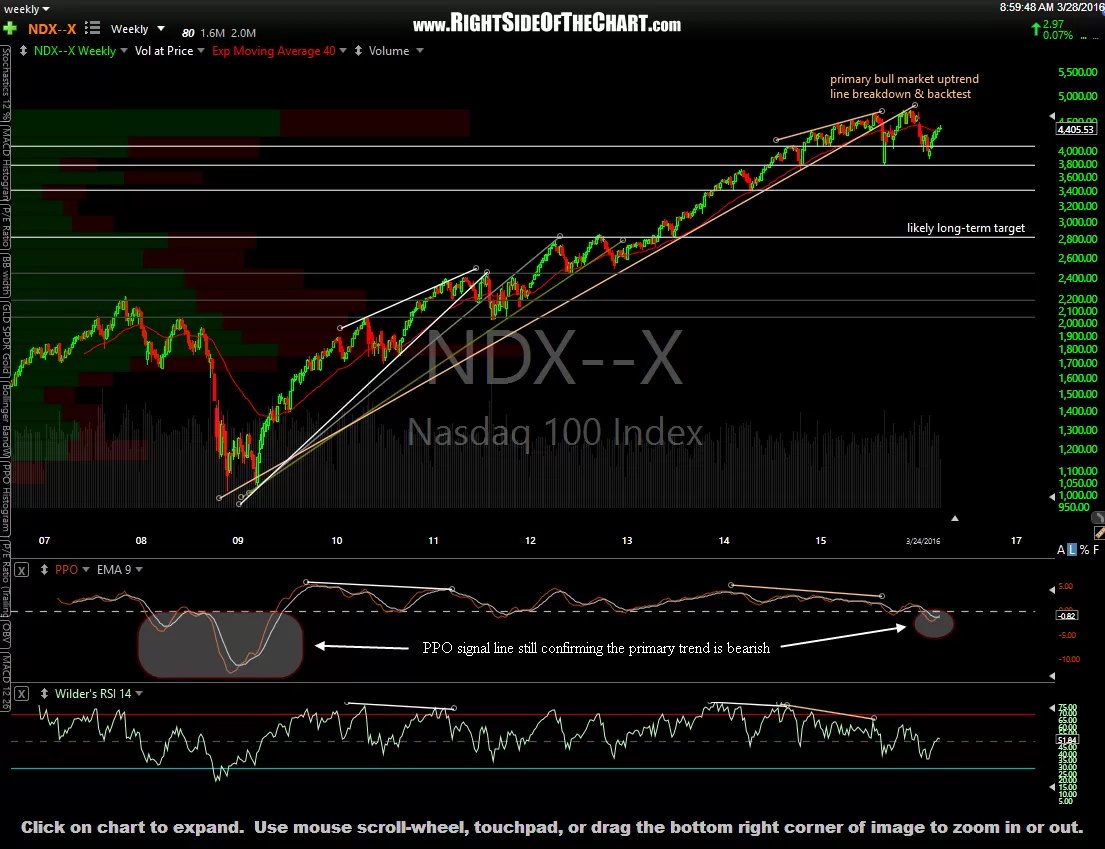
- $NDX weekly March 28th
-
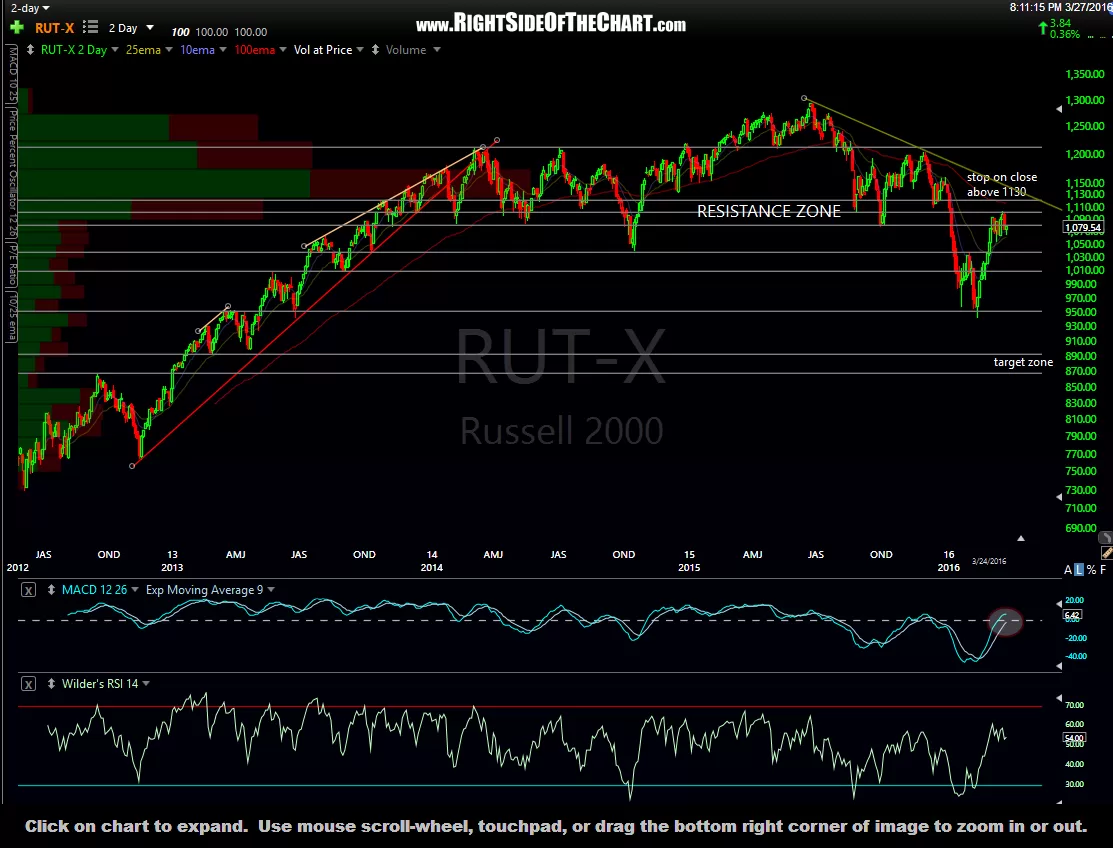
- $RUT 2-day period March 28th
-
- QQQ 60-minute March 28th
On an administrative note, I’ve worked all weekend identifying & fixing as many of the issues affecting the website since upgrading to the new interface on Thursday. There’s still a few minor changes to be made, such as the restoring the previous pan & zoom functionality when viewing charts, which we hope to have restored shortly. Thanks to all for you feedback and highlighting some of the issues following the upgrade last week & please continue to let me know if you have any issues or suggestions on using the site.
note: these charts were made in pre-market today. I thought I had clicked the submit button to publish the post but just noticed that it never went thru.