
Here’s a quick look at a few of the major US large cap indices. Live, annotated versions of all of these charts are available via the Live Charts page.
The $NDX (Nasdaq 100) will likely fall more than the $SPX in the coming weeks months and still has plenty of downside to my current final price target (T3). At this time, T2 is my preferred price target.
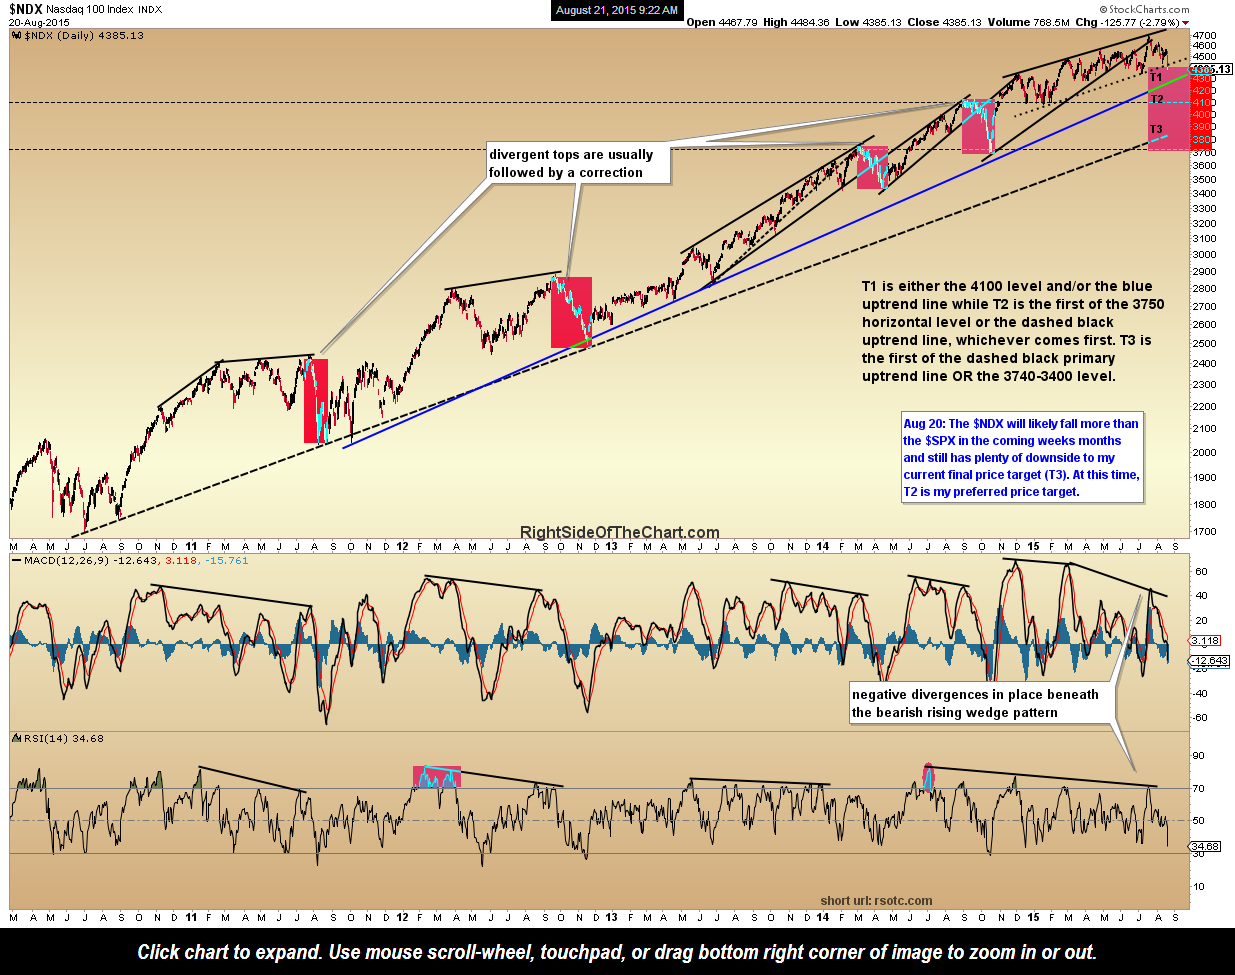
$NDX daily Aug 20th close
Although the $SPX (S&P 500) closed below the solid blue uptrend line, it also closed right on the bottom of the 2015 sideways trading range, i.e.- support (dashed blue parallel lines).
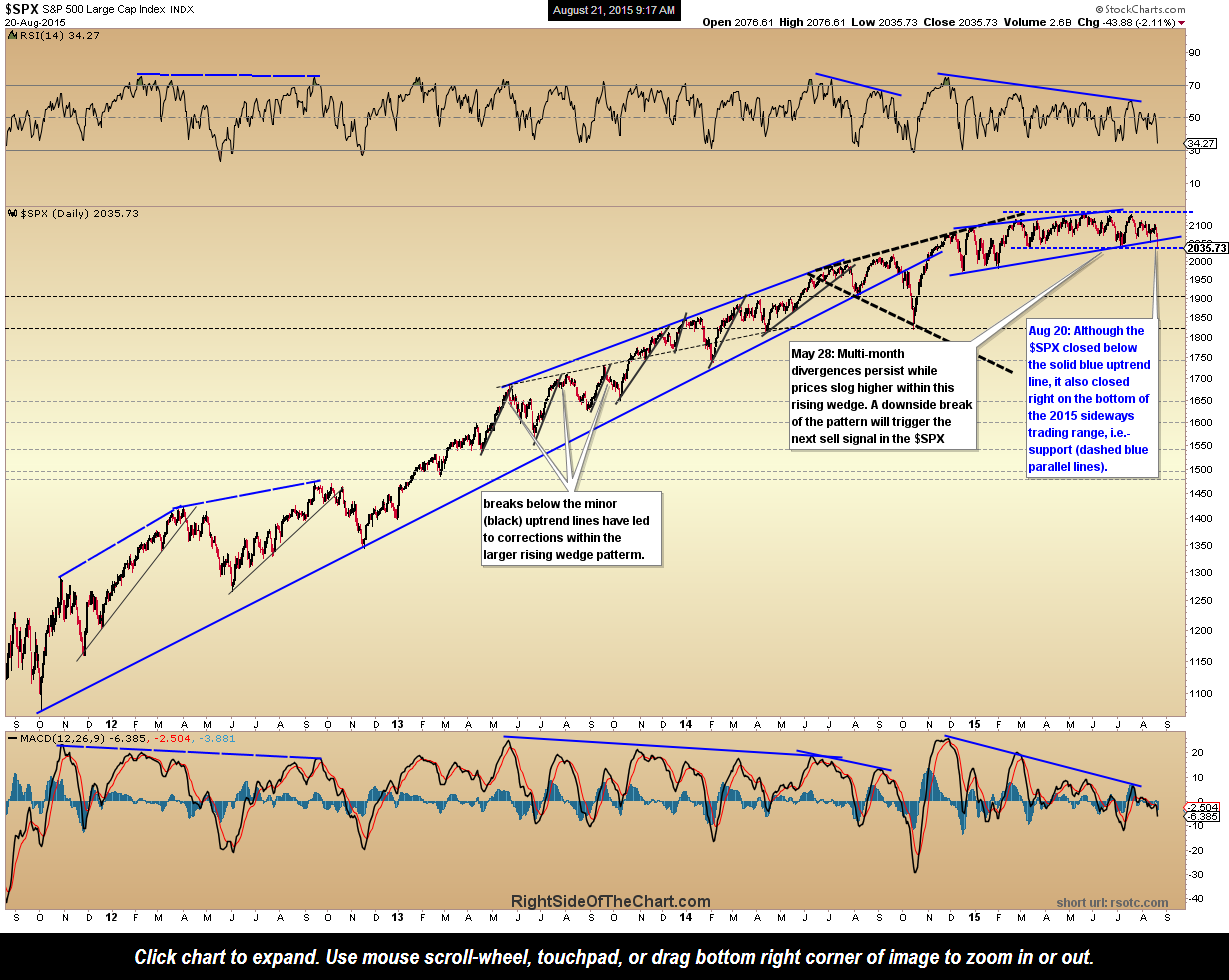
$SPX daily Aug 20th close
The $DJA (Dow Jones Composite) also closed right on horizontal support & as with the $SPX, also sits in a very precarious technical position. Therefore, should the markets close down sharply again today, nearly all major US indexes will have broken key support levels, opening the door to additional selling in the days, weeks & possibly months to come.
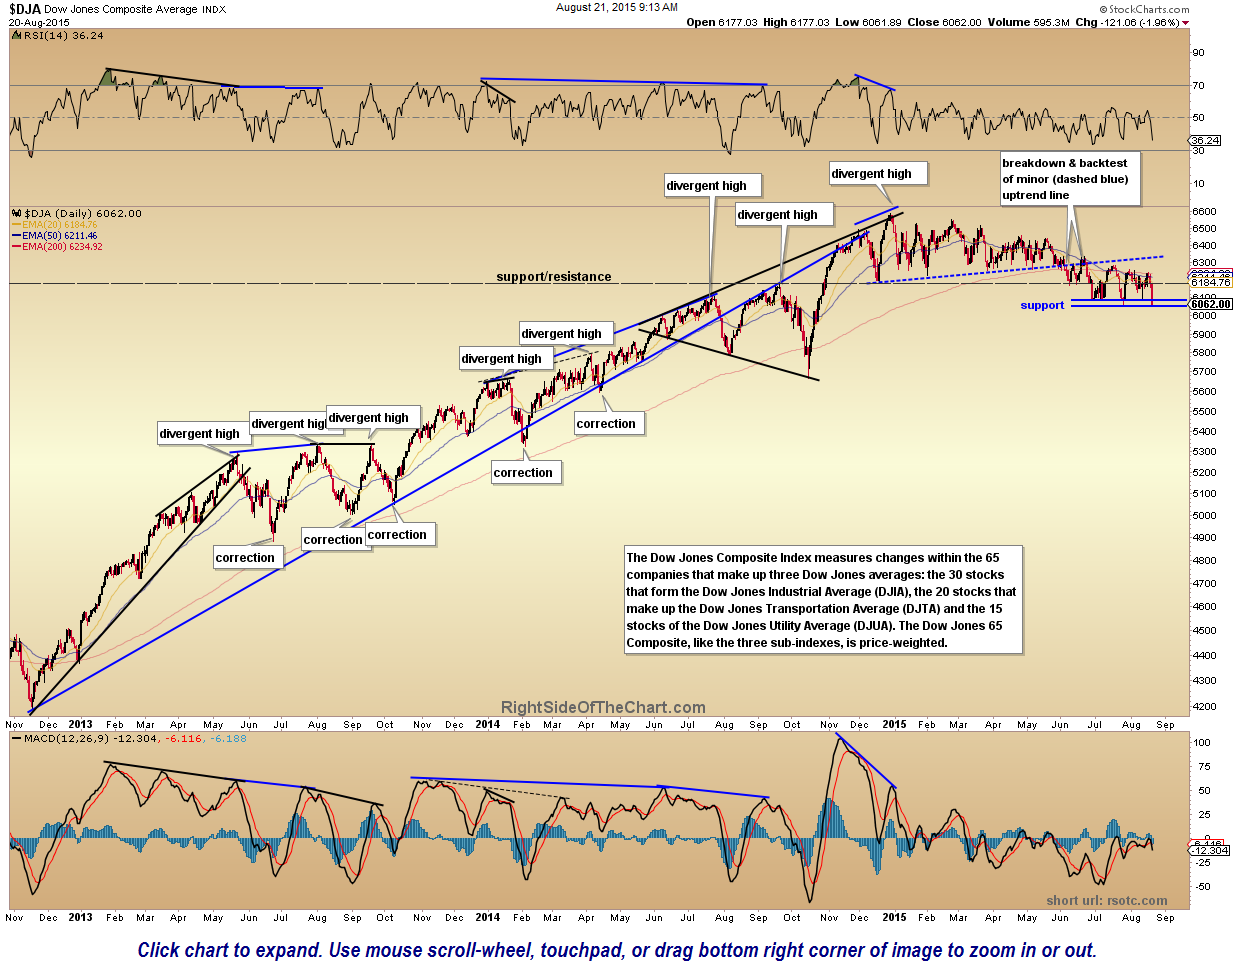
$DJA daily Aug 20th close