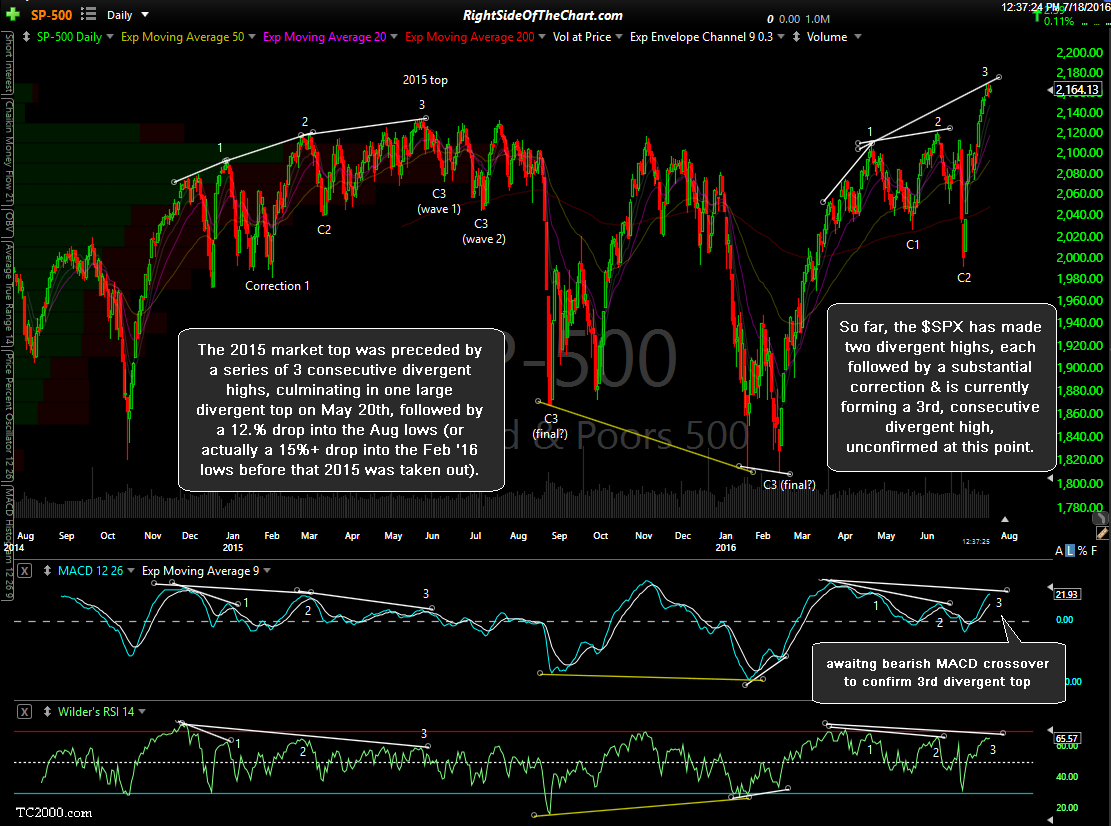
As covered in the July 10th market outlook video, the 2015 market top was preceded by a series of 3 consecutive divergent highs, culminating in one large divergent top on May 20th, followed by a 12.% drop into the Aug lows (or actually a 15%+ drop into the Feb ’16 lows before that 2015 was taken out). So far, the $SPX has made two divergent highs, each followed by a substantial correction & is currently forming a 3rd, consecutive divergent high, unconfirmed at this point as the MACD needs to make a bearish crossover to put in new lower high below the MACD peak back in March in order to confirm the current potential divergences.
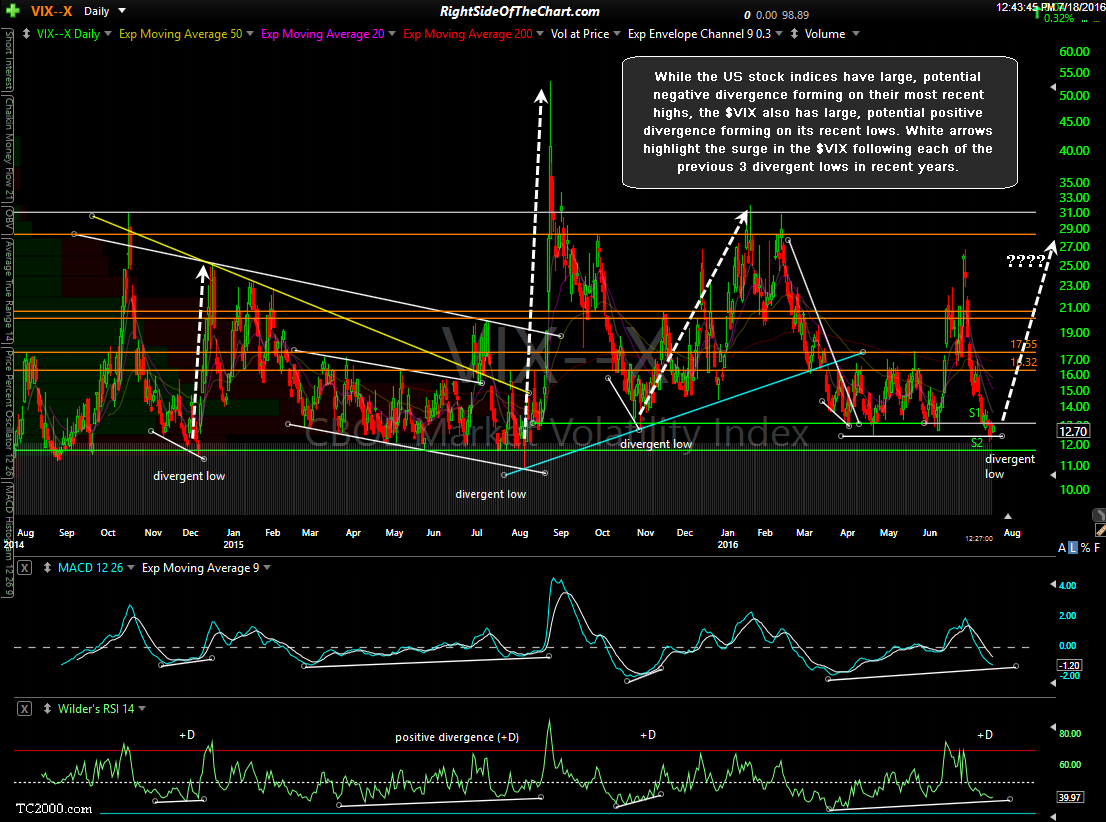
While the US stock indices have large, potential negative divergence forming on their most recent highs, the $VIX also has large, potential positive divergence forming on its recent lows. White arrows highlight the surge in the $VIX following each of the previous 3 divergent lows in recent years. Should the $SPX experience even a half-decent pullback soon, that would most likely cause a pop in the $VIX which could help to confirm this divergent low which come in around a key long-term support zone.


