
/NG (natural gas futures) has triggered the next buy signal/objective long entry or add-on to an existing position on today’s breakout above the 1.869 resistance level. It is worth noting that there are potential (i.e.- unconfirmed) divergences forming between price & the momentum indicators although as of now, the breakout is intact without any sell signals or indications of a reversal in nat gas. As such, this breakout opens the door for a move up to my next (unadjusted*) target of 1.964 on the 60-minute chart below.
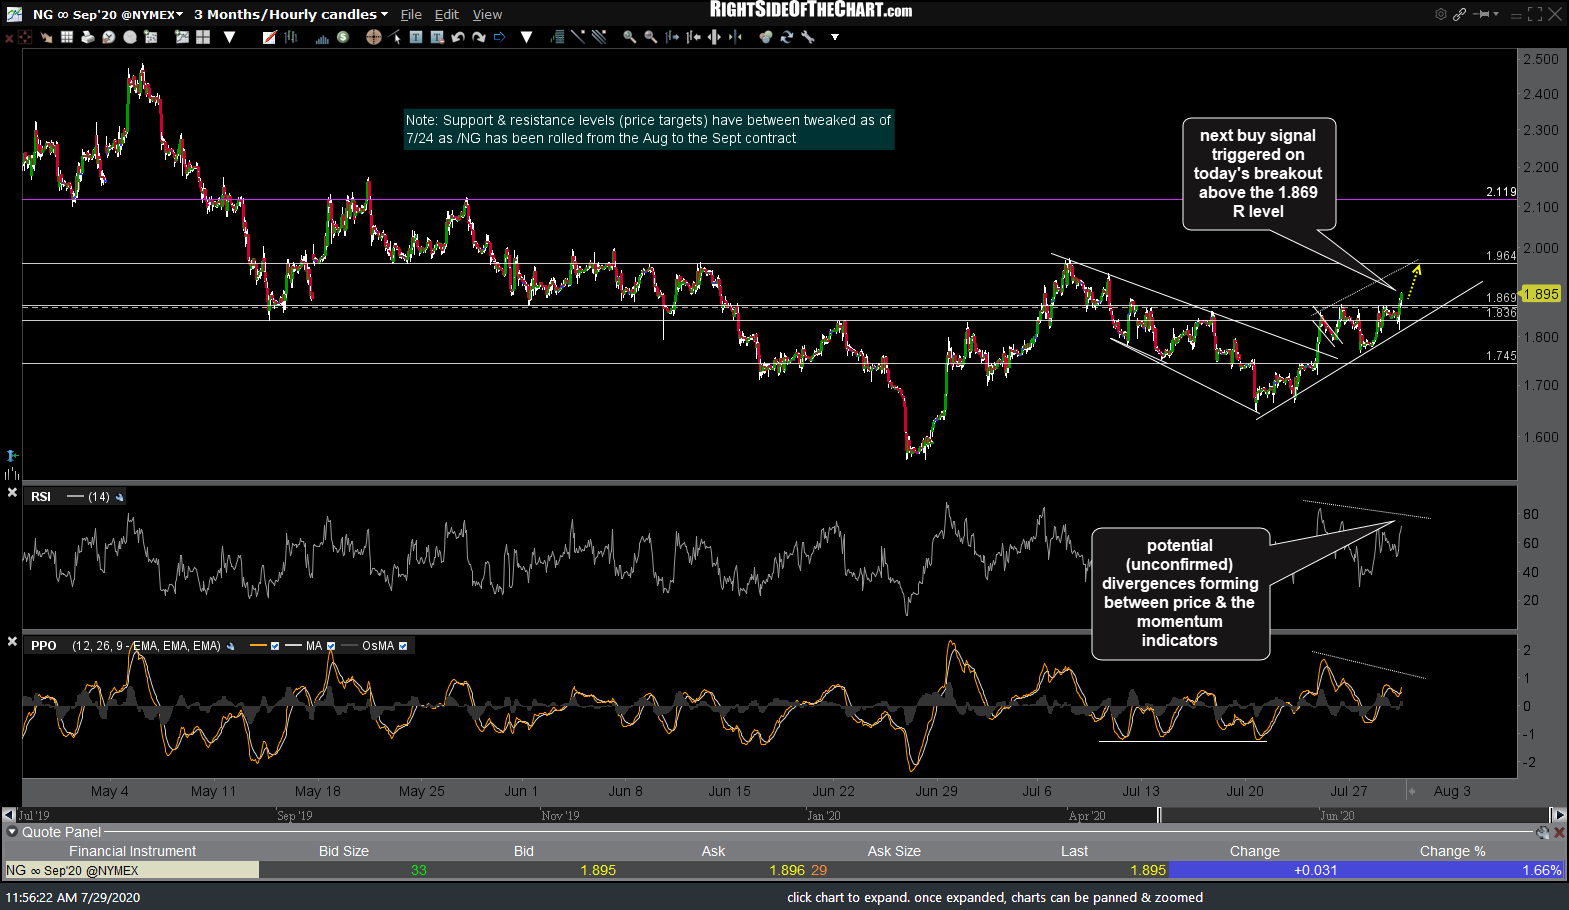
NG 60m July 29th
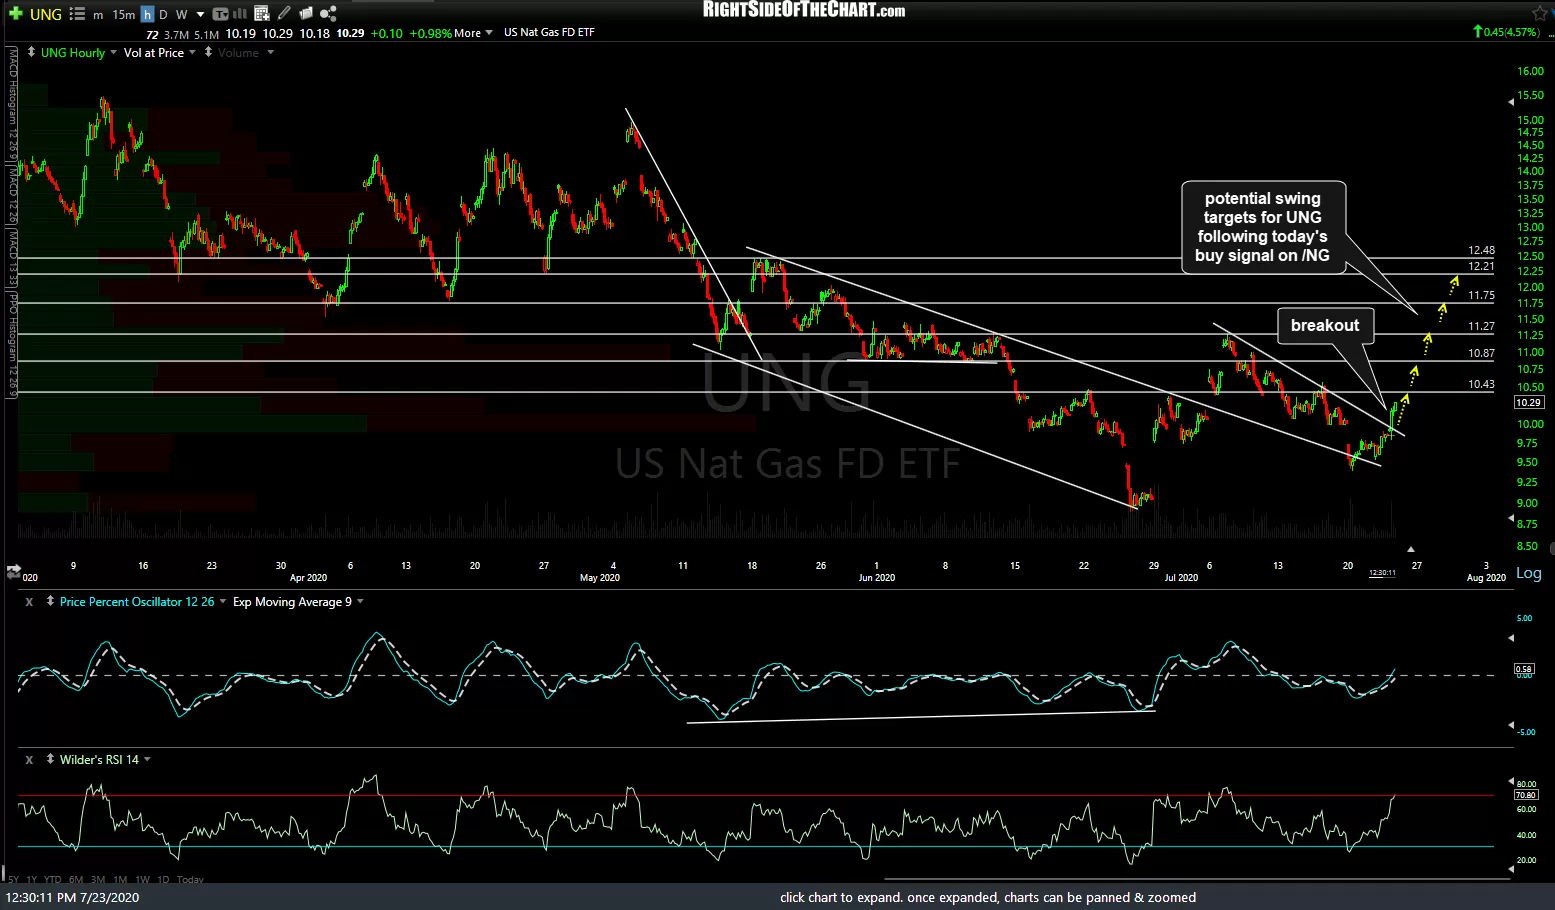
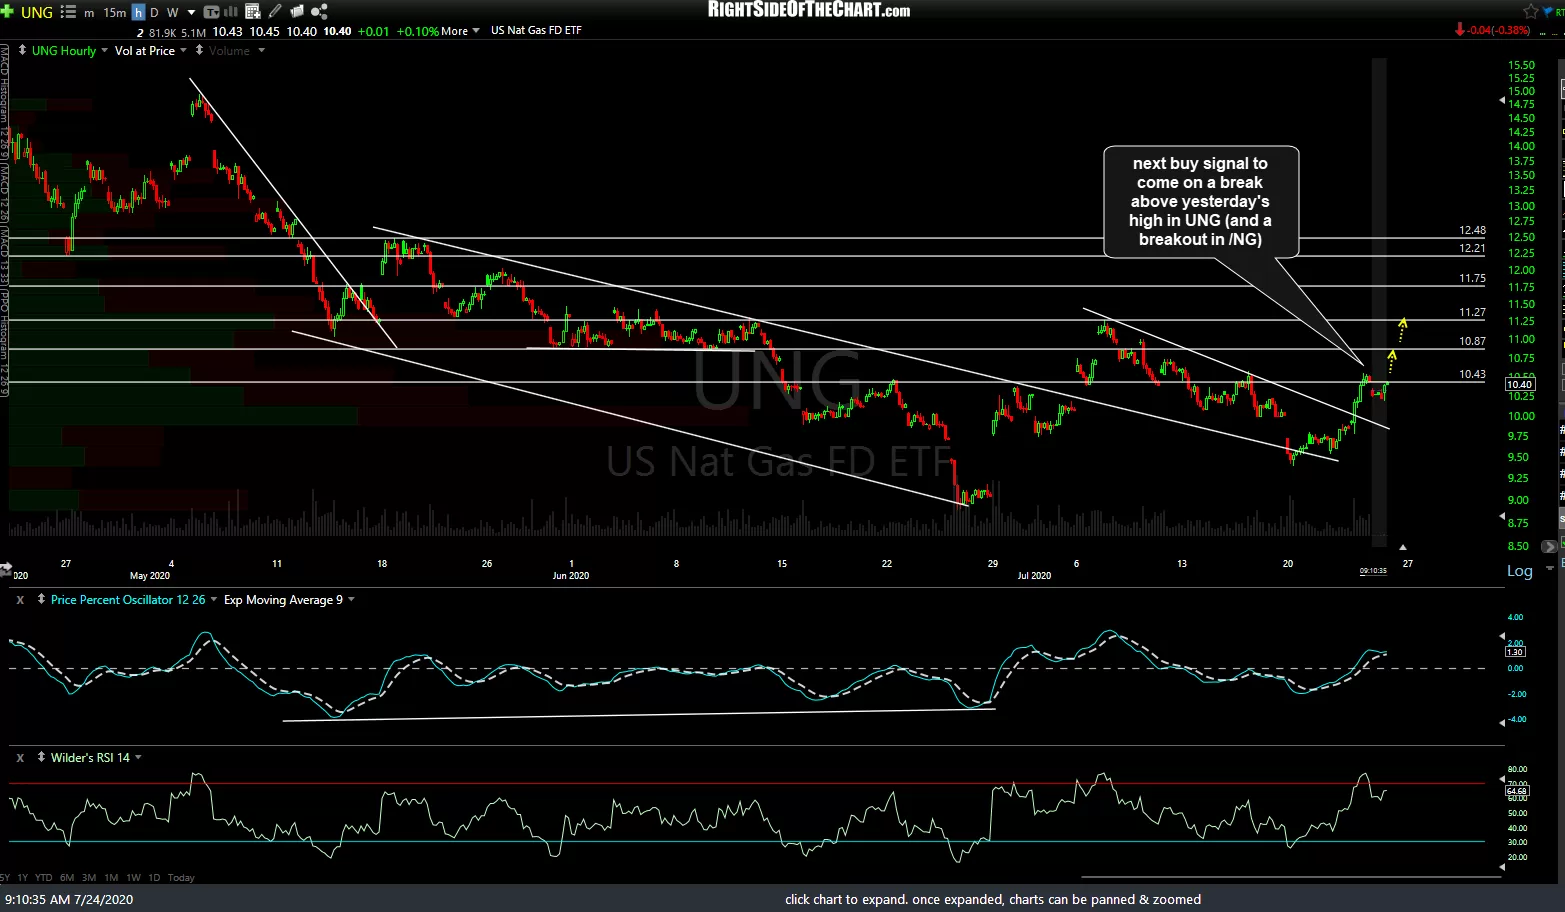
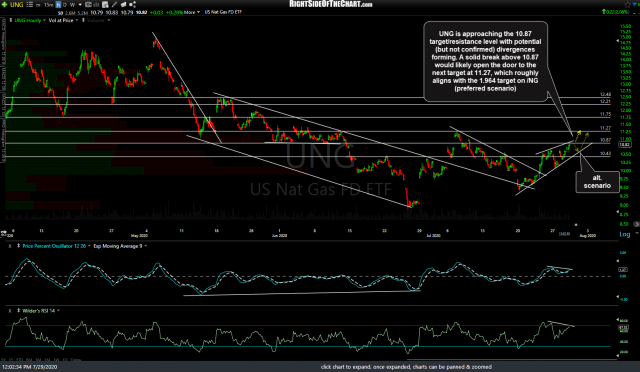
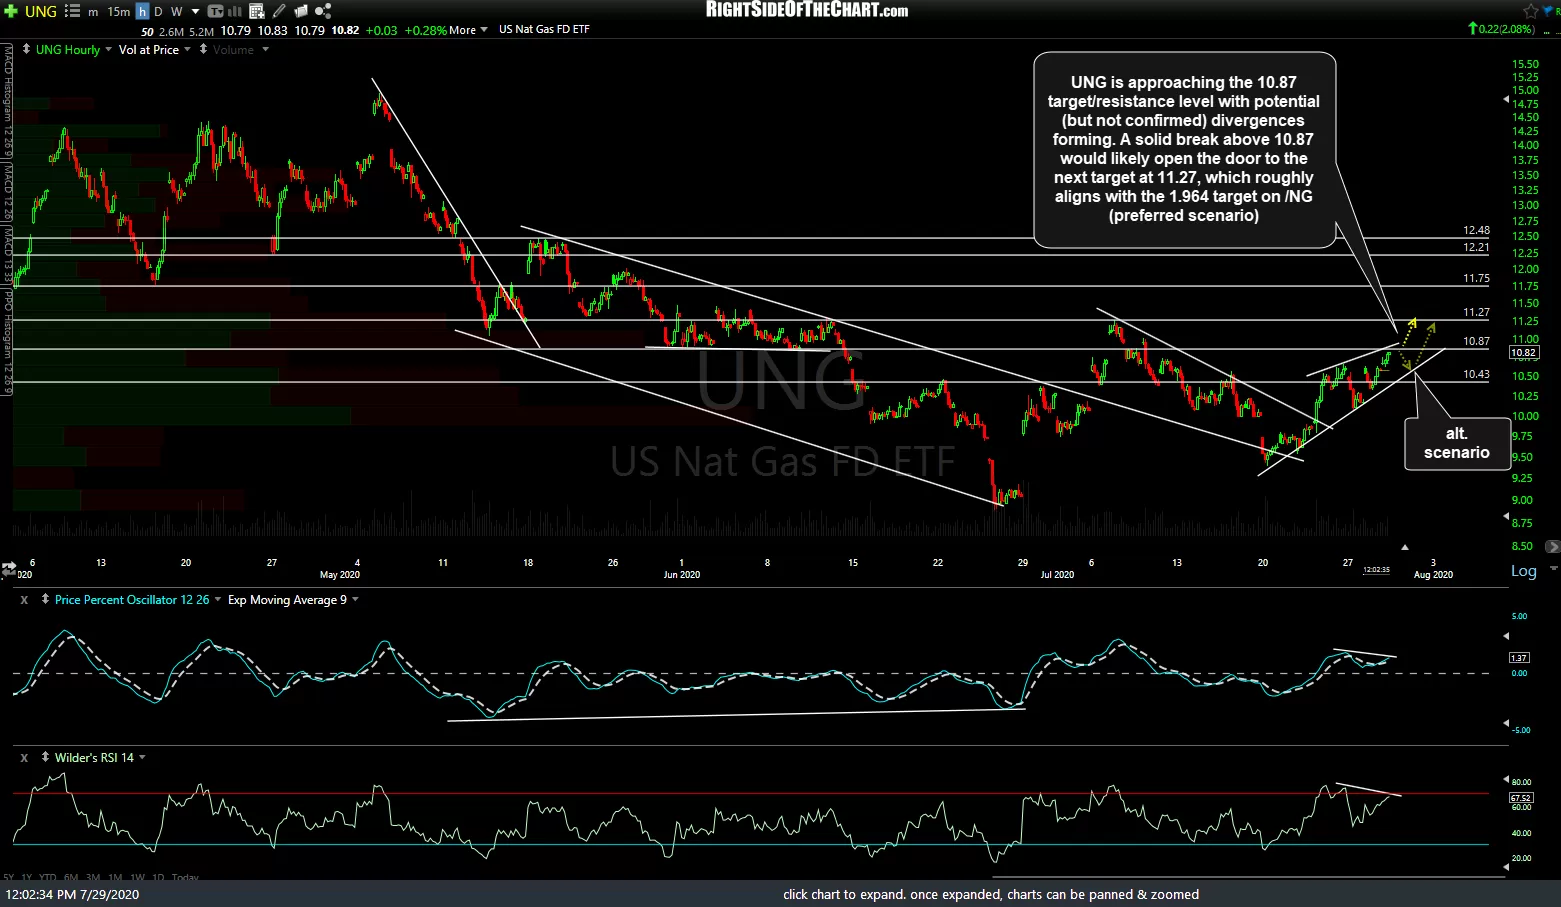
UNG (nat gas ETN) is approaching the 10.87 target/resistance level with potential (but not confirmed) divergences forming. A solid break above 10.87 would likely open the door to the next target at 11.27, which roughly aligns with the 1.964 target on /NG, which is my preferred scenario, with my alternative scenario shown by the lighter arrows in the last 60-minute chart below**, which follows the previous 60-minute charts of UNG, starting with the breakout/buy signal on July 23rd, with UNG rallying over 10% since that breakout.
-
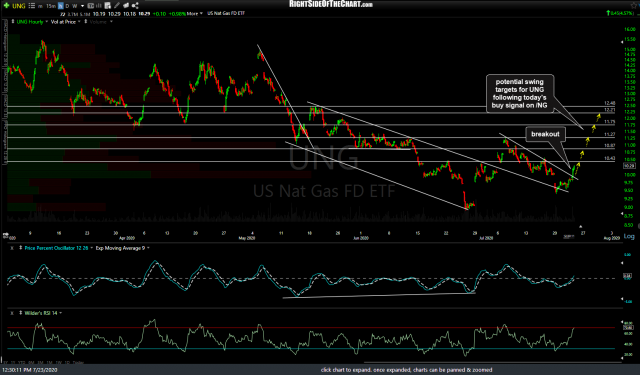
- UNG 60m July 23rd.png
-
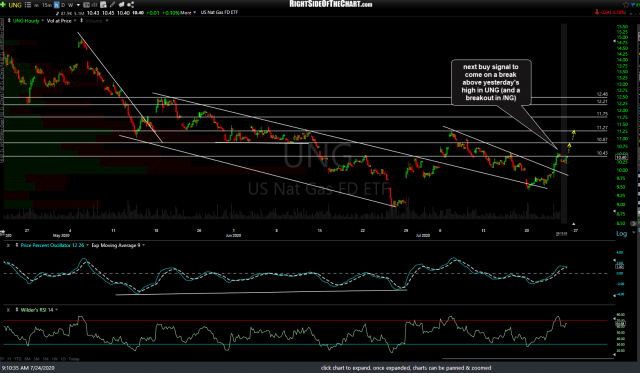
- UNG 60m July 24th
-
- UNG 60m 2 July 29th
*As an ‘unofficial’ trade idea, the price targets on these charts are unadjusted targets, or the actual resistance levels in which a reaction is likely upon the initial tag of those levels from below. On the official trades, I will usually set the price target(s) slightly below the actual resistance level in which a reaction is likely in case the sellers step in a bit early.
**Multiple charts in a gallery format, such as the 3 UNG charts above, will not appear on the subscriber email notifications but may be viewed on rightsideofthechart.com or rsotc.com (short url). Click on the first gallery chart to expand, then click on the right arrow to advance to the next full-size chart. Once expanded, the charts can be panned or zoomed for additional detail.