
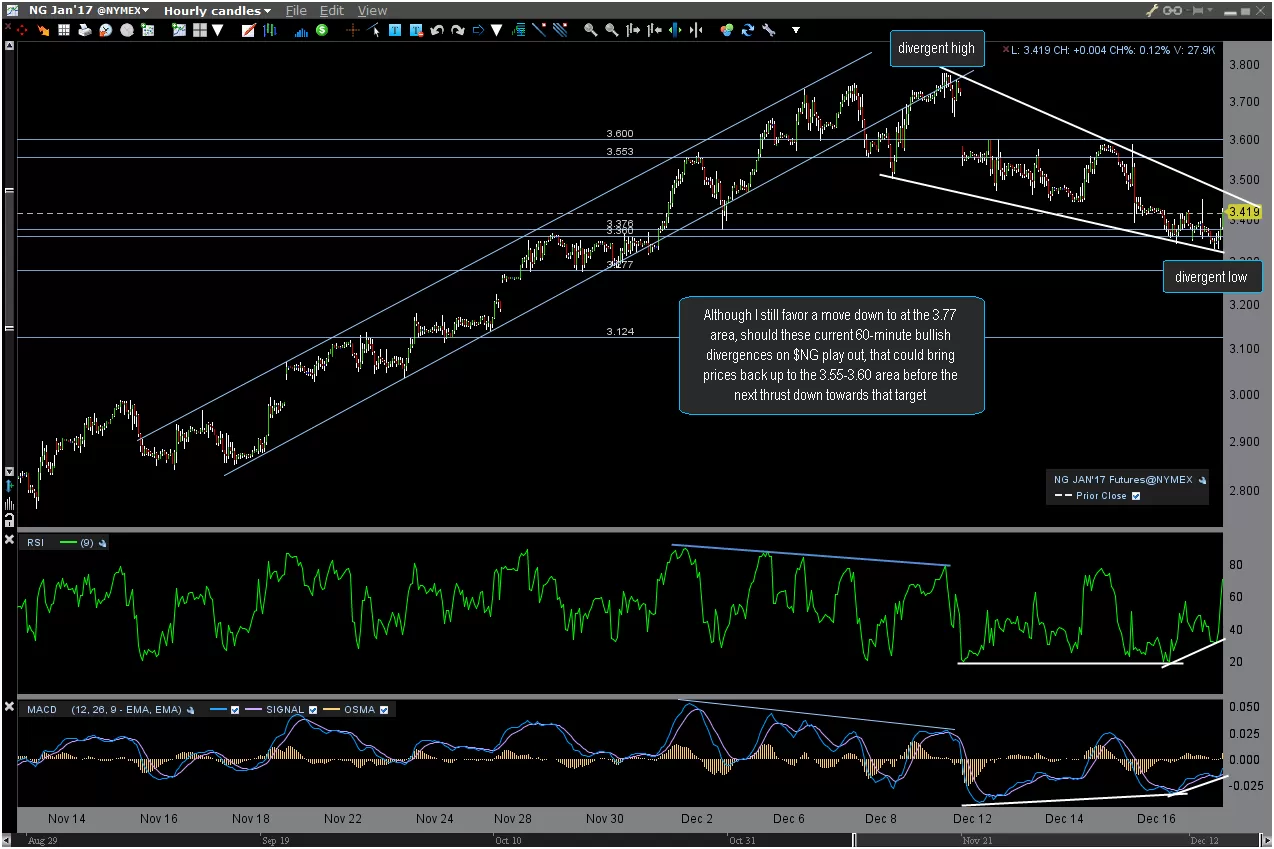
Although I still favor a move down to at the 3.77 area in natural gas futures, should these current 60-minute bullish divergences on $NG play out, that could bring prices back up to the 3.55-3.60 area before the next thrust down towards that target. This $NG 60-minute chart is reflects today’s pre-market trades while the 60-minute UGAZ chart below is as of Friday’s close.
-
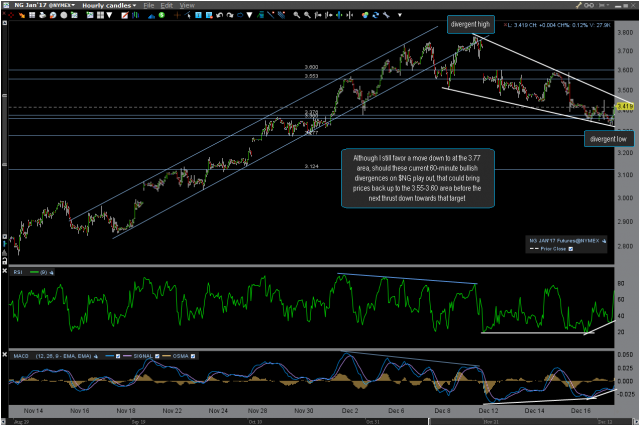
- $NG 60-minute Dec 19th
-
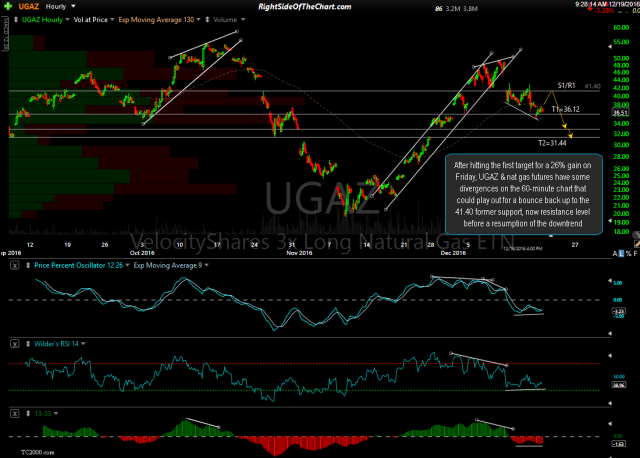
- UGAZ 60-minute Dec 16th close
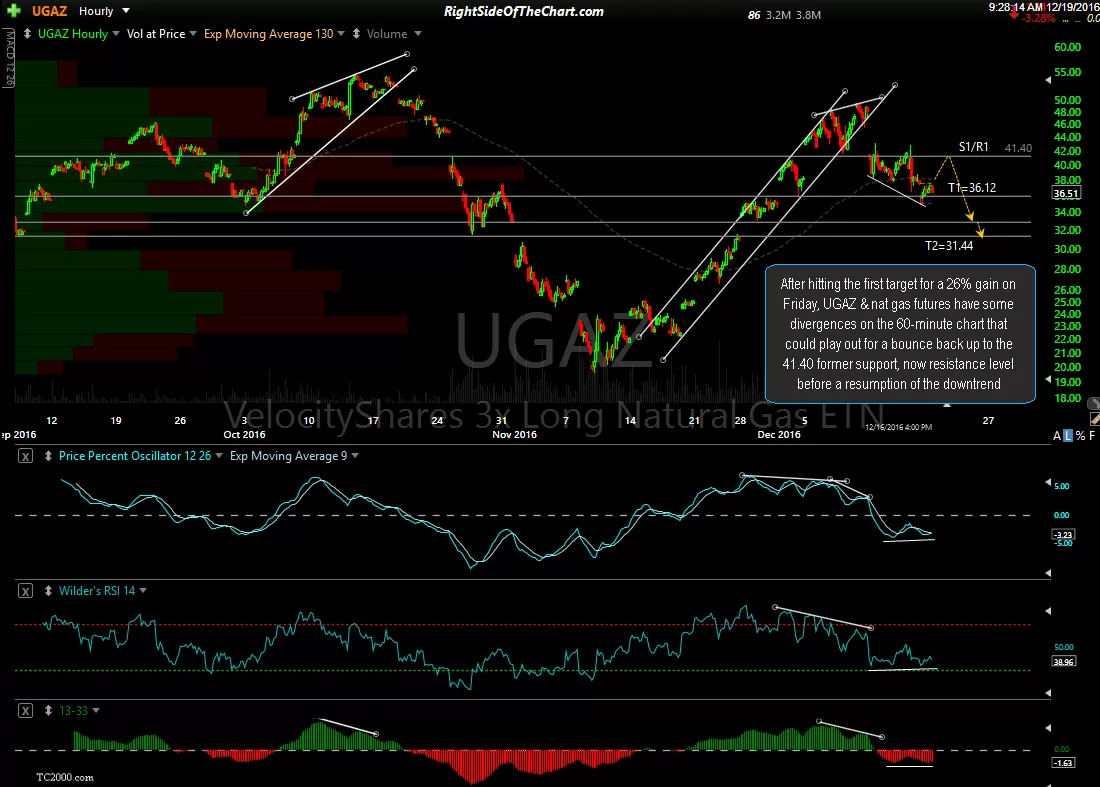
After hitting the first target for a 26% gain on Friday, UGAZ & nat gas futures have some divergences on the 60-minute chart that could play out for a bounce back up to the 41.40 former support, now resistance level before a resumption of the downtrend. The 3.77 support/target on $NG correlates to the 33.00ish level on UGAZ which is the horizontal support line sitting just above the 2nd & final price target of 31.44. Depending on how the charts play out going forward, whether or not nat gas is able to mount a decent counter-trend bounce here or not, the final target on the UGAZ short trade might be revised higher or lower & possibly to that 33.00ish support level.