
Several members have posted some of their trades and analysis as well as inquires on natural gas & UGAZ (3x Bullish Natural Gas ETN) in the trading room today & as it appears that nat gas could be setting up for a tradable rally, UGAZ is on watch for a potential swing trade candidate.
The first chart below is a 3½ year daily chart of $NATGAS (continuous futures contract). Following a (not surprising… see the seasonality charts below) 30%+ plunge in nat gas prices in just the past two weeks, nat gas has fallen to just above the key 2.50ish support area which has acted as support & resistance on several occasions in recent years. Nat gas prices rallied today & should it continue to build on those gains in the coming sessions, it will confirm the potential positive (bullish) divergences that are forming on the momentum indicators below, setting the stage for a potential multi-week+ rally that could run well into the double digits.
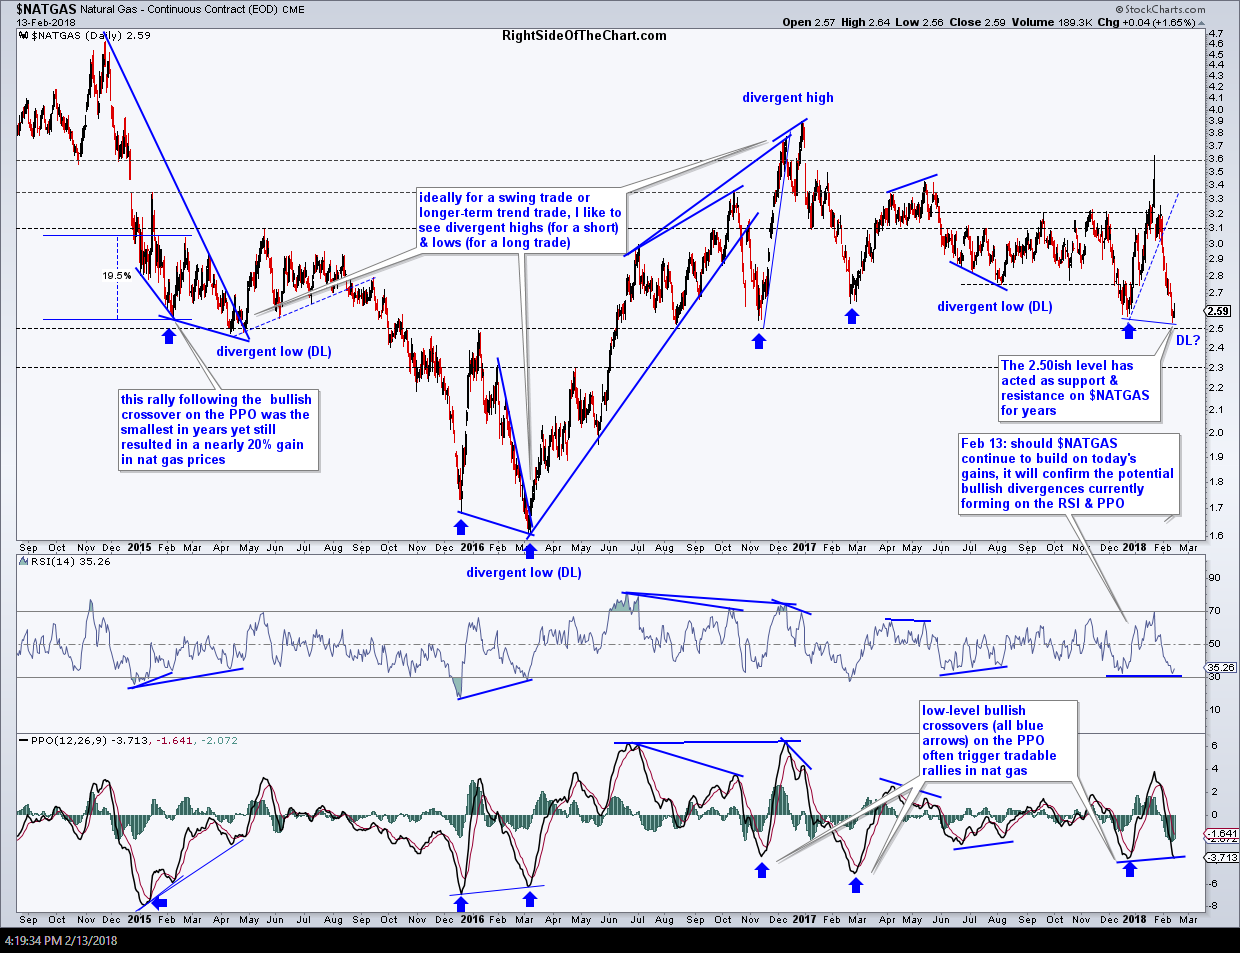
$NATGAS daily Feb 13th
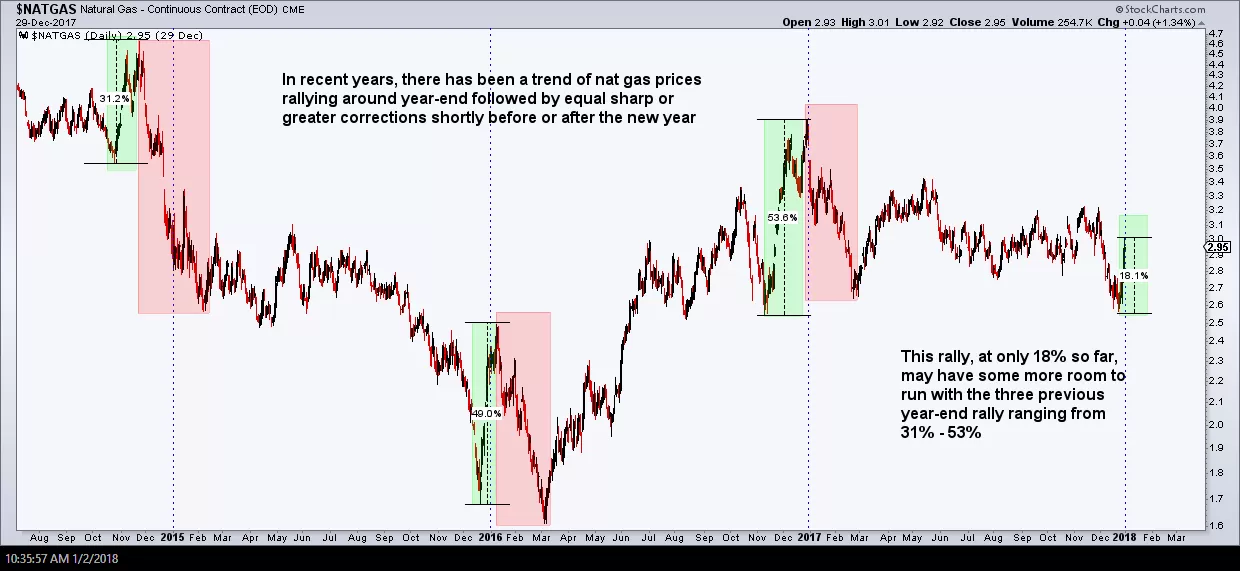
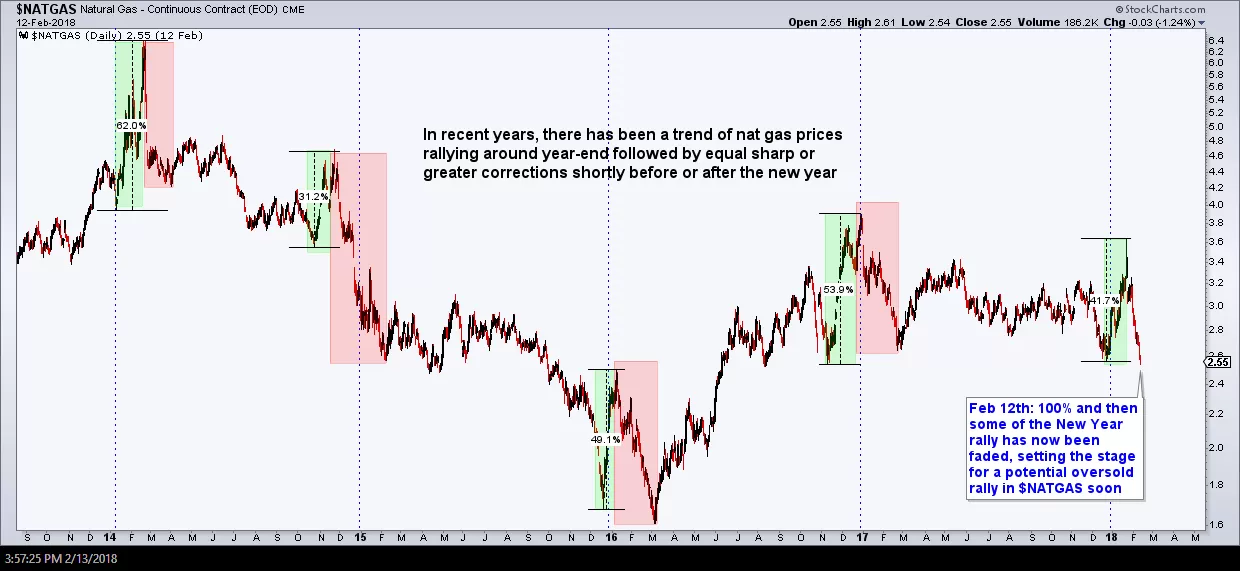
Adding to the case for a potential reversal & rally in nat gas is the pattern of seasonality that was highlighted back on January 2nd in the first chart below, stating at the time that I thought nat gas had more room to run. UGAZ was added an official long swing trade 3 days later with that trade going on to hit its price target for a 12% profit in just two trading sessions. With the end of year rally, which turned out to be good for a 42% gain (right around the average for the previous New Year’s rallies in recent years) having now been fully faded & then some with the sharp drop over the last two weeks, nat gas could be primed for the initial kick-back/oversold rally that has followed every one of the initial fades in recent years.
-

- $NATGAS year-end trends Jan 2nd
-
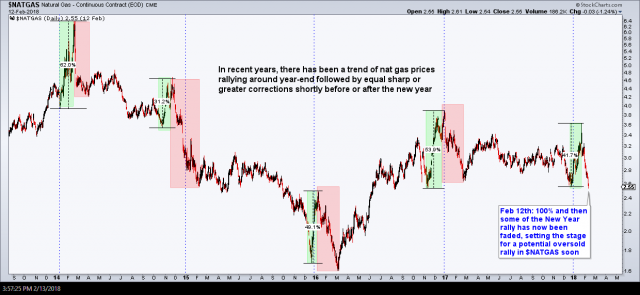
- $NATGAS year-end trends Feb 13th
(click on first chart above to expand, then click on right of chart to advance to the next expanded image)
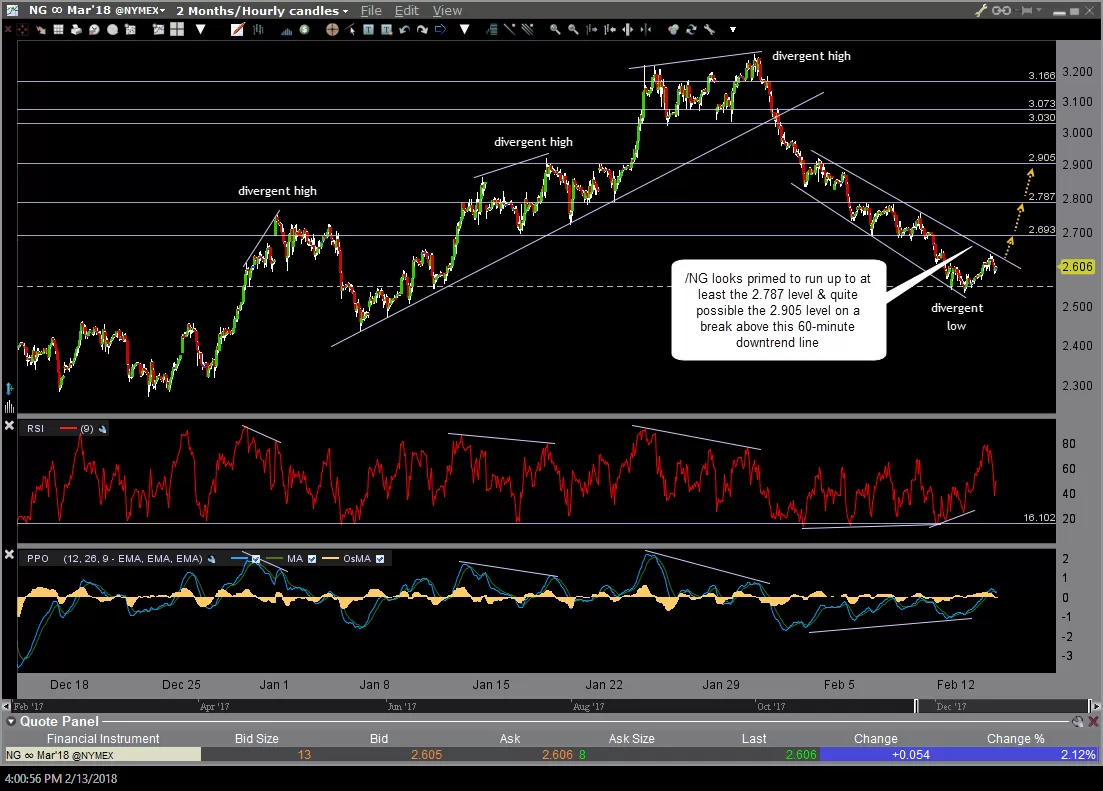
Finally, timing is everything when trading natural gas as not only does it move fast but the daily price swings can easily measure in the high single-digits to even the low double-digits in percentage gains & losses. The first chart below is the 60-minute chart of the March /NG (natural gas futures) contracts. /NG recently put in a divergent low but then again, it has been putting in a divergent low for over a week now & as I often say, divergences alone are not a buy or sell signal, merely an indication that a pending trend change is likely to occur soon.
-

- NG 60-min Feb 13th
-

- UGAZ 15-min Feb 13th
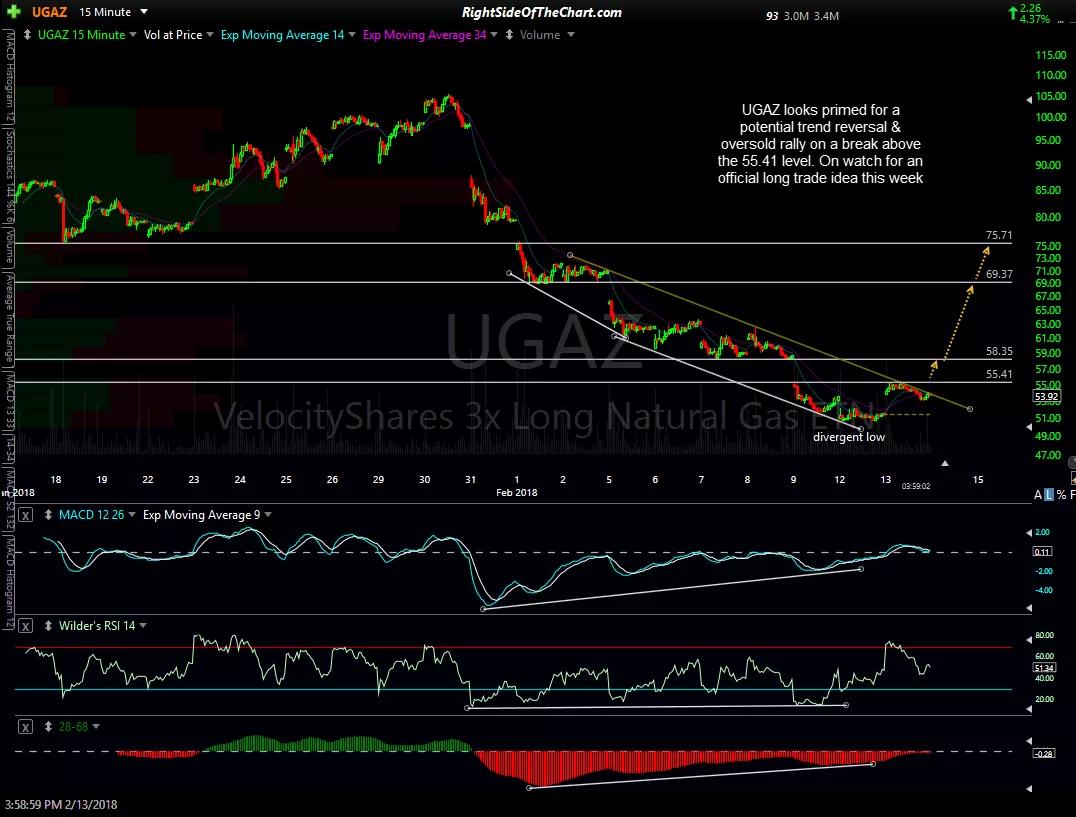
I’d like to see /NG take out the downtrend line that it reversed off of earlier today & that could happen soon or possibly after another thrust down below the recent lows. I’d also like to see UGAZ take out the yellow downtrend line on the 60-minute chart above as well as the 55.41 level. If so, UGAZ might be added as an official long swing trade but I wanted to share these charts in advance as nat gas can move quickly & could even take out those resistance levels in one of the overnight trading sessions this week. As of now, UGAZ is an unofficial long setup with exact price targets, entry point(s) and suggested stop(s) to follow if added as an official trade idea.