
UGAZ (3x long/bullish natural gas ETN) offers an objective long entry on this impulsive breakout above both downtrend lines (including the bullish falling wedge pattern) and will be added as an Active Long Swing Trade around current levels.
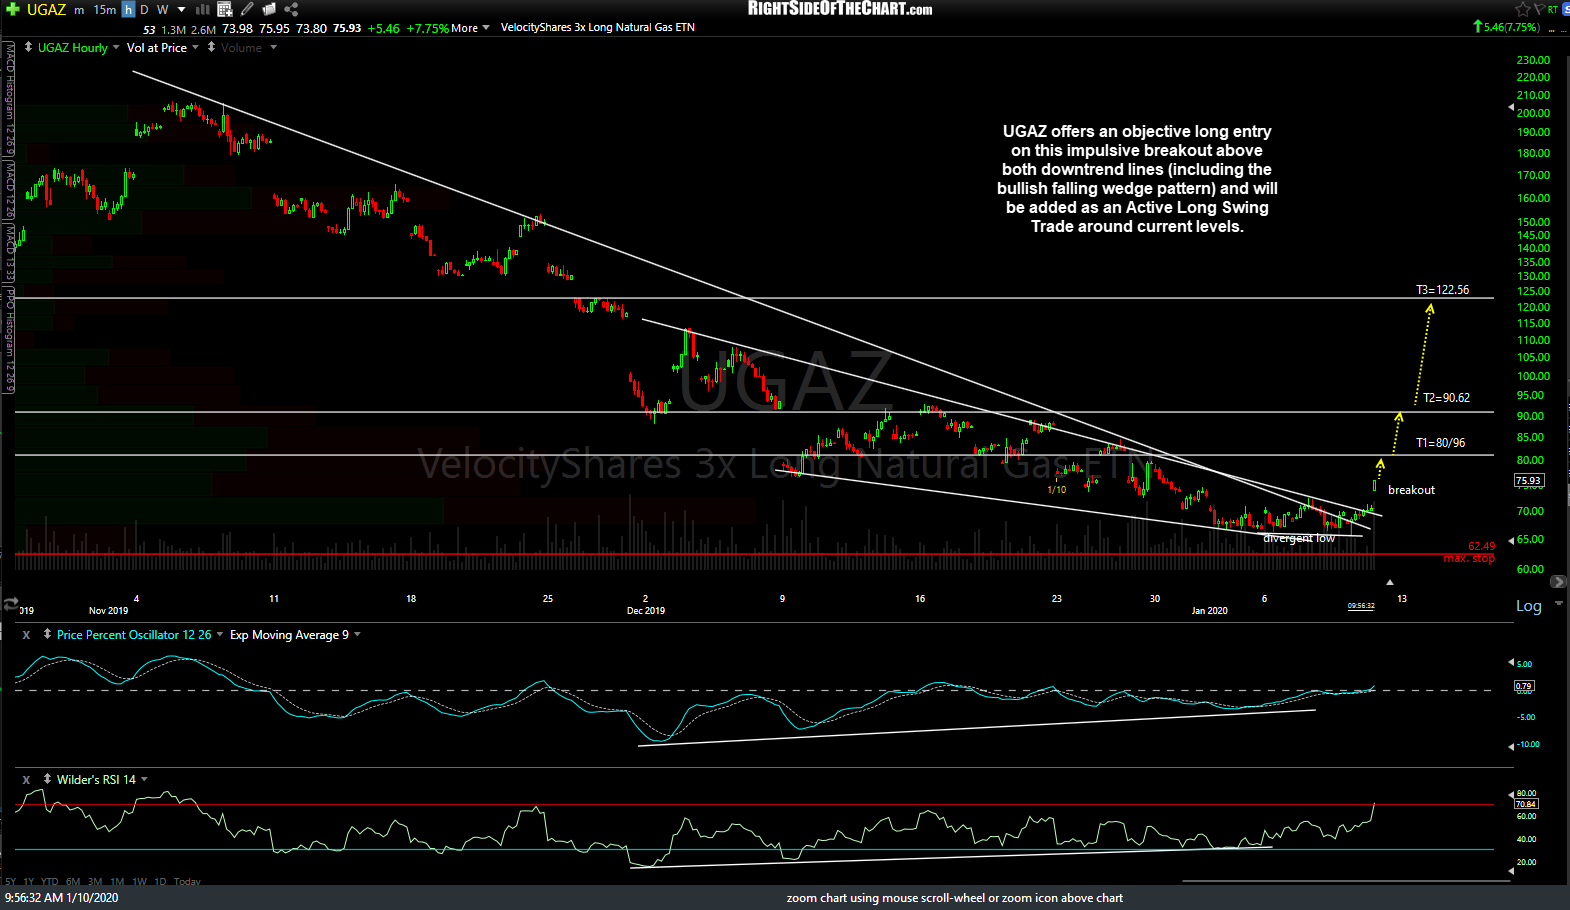
UGAZ 60m 2 Jan 10th
The price targets are T1 at 80.96, T2 at 90.62 & T3 at 122.56 with a maximum suggested stop (if targeting T3) of 62.49. To account for the 300% leverage factor as well as the volatility of natural gas prices, the suggested beta-adjusted position size is 0.25-0.35. If only targeting T1 or T2, consider a tighter stop using an R/R ratio of at least 2:1 or better.
For those trading /CL (nat gas future) or /QG (Miny nat gas futures contract), the 60-minute chart with price targets below was posted earlier today in the comment section below the previous trade setup post on UGAZ. t’s the same 60m chart I’ve been highlighting in recent videos although I modified that larger downtrend line off the early Nov highs which now comes in that same first target zone that runs from above 2.263-2.280.
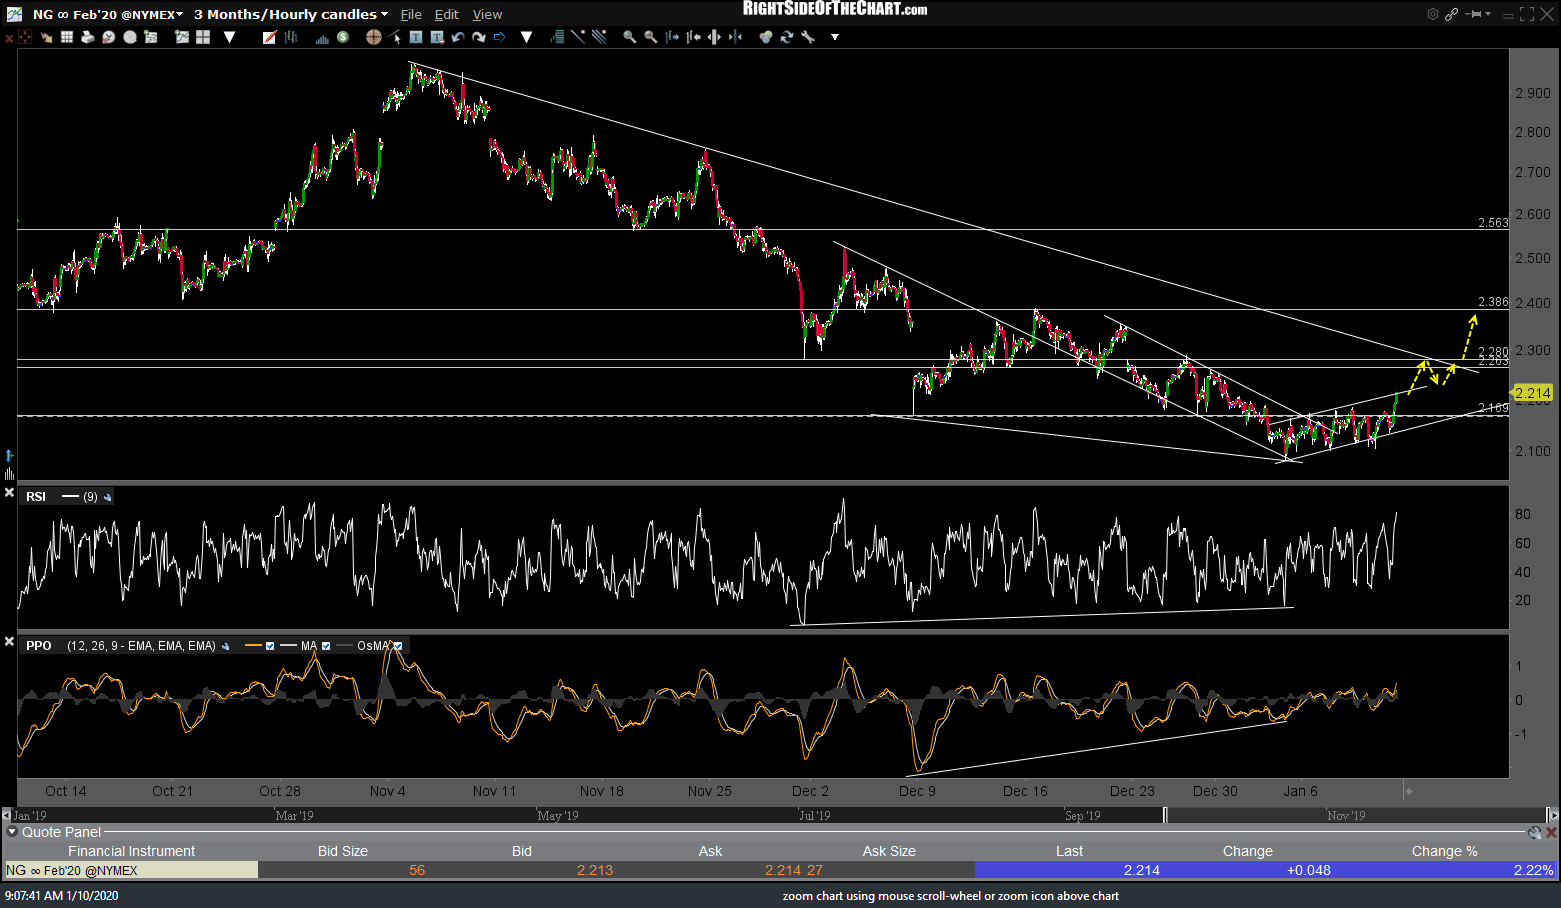
NG 60m Jan 10thAS
The odds for a reaction if/when those intersecting resistance levels are hit are decent, followed by another leg up to the 2.386ish resistance/target. If & when /NG starts to approach 2.386, I will assess the charts at the time to determine if additional upside is likely.