
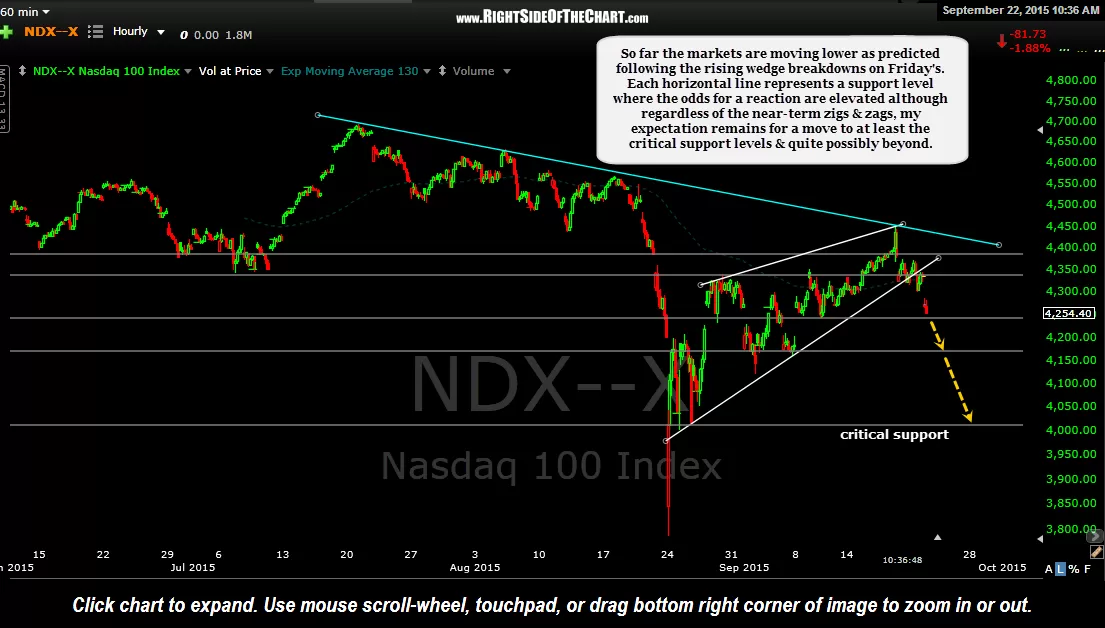
U.S. equities continue to move lower following the rising wedge breakdowns on Friday. Each horizontal line represents a support level where the odds for a reaction are elevated although regardless of the near-term zigs & zags, my expectation remains for a move to at least the critical support levels & quite possibly beyond.
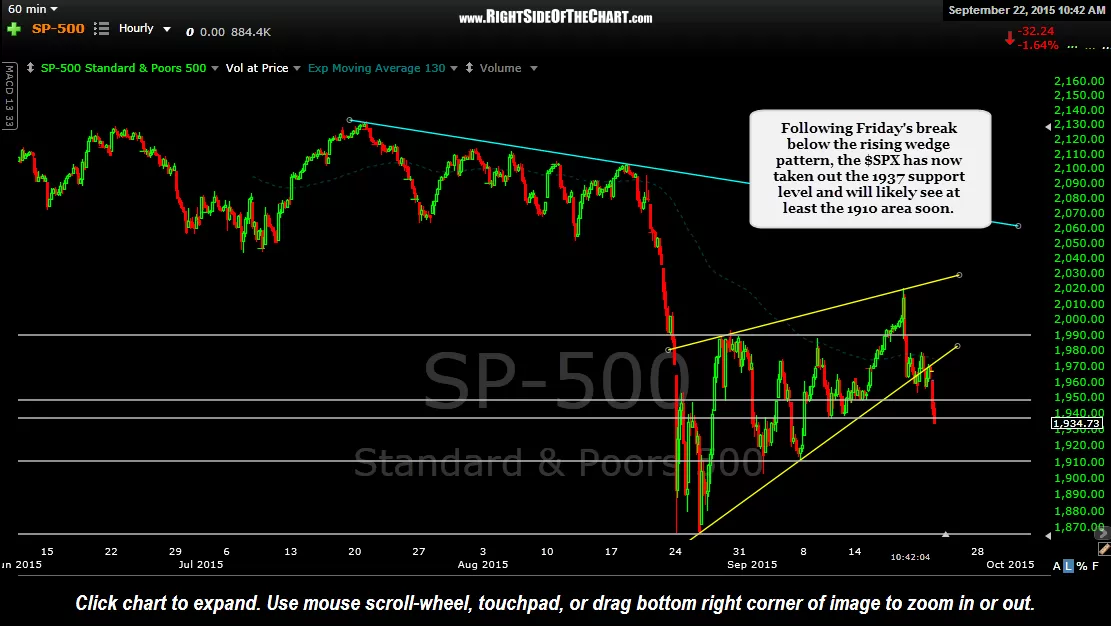
Following Friday’s break below the rising wedge pattern, the $SPX has now taken out the 1937 support level and will likely see at least the 1910 area soon although it is worth noting that the $NDX is currently trading at support where we could see a reaction. Despite the fact that the market has traded in a very choppy, albeit upwards range from the Aug 24th/26th lows until last Thursday, all of my trend indicators, such as the recently discussed intermediate-term & weekly long-term trend, as well as my short-term trend indicators remained on sell signals despite the recent oversold rally. The previous (posted Friday) & updated 60-minute charts of $SPX & $NDX below:
-
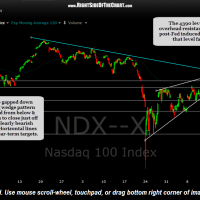
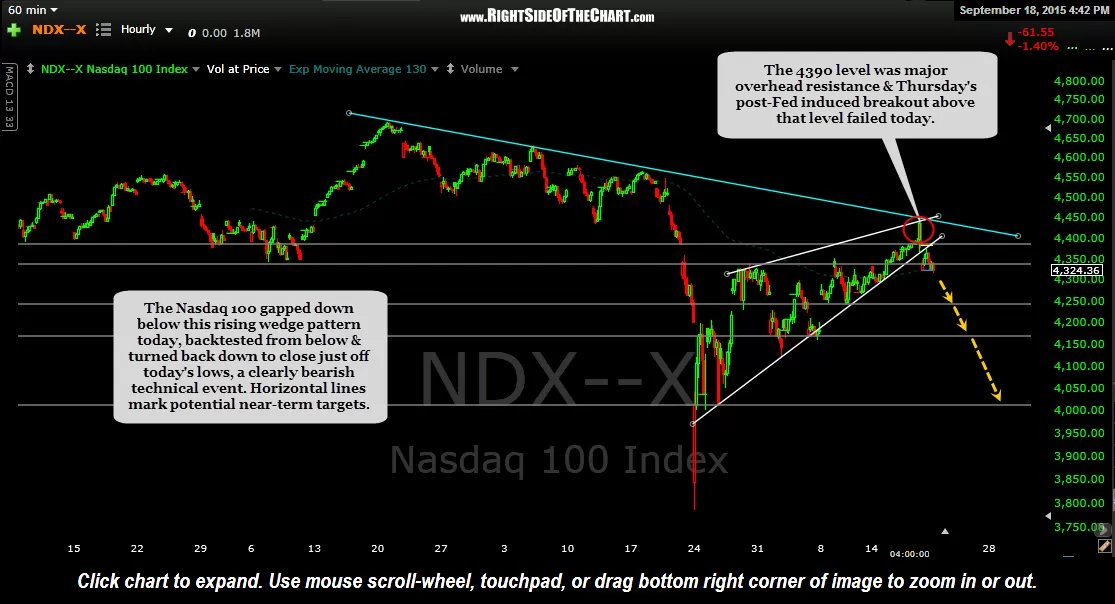
- $NDX 60 minute Sept 18th
-
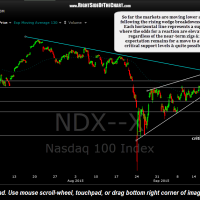
- $NDX 60 minute Sept 22nd
-
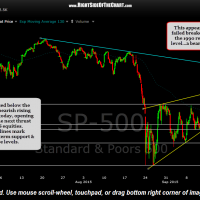
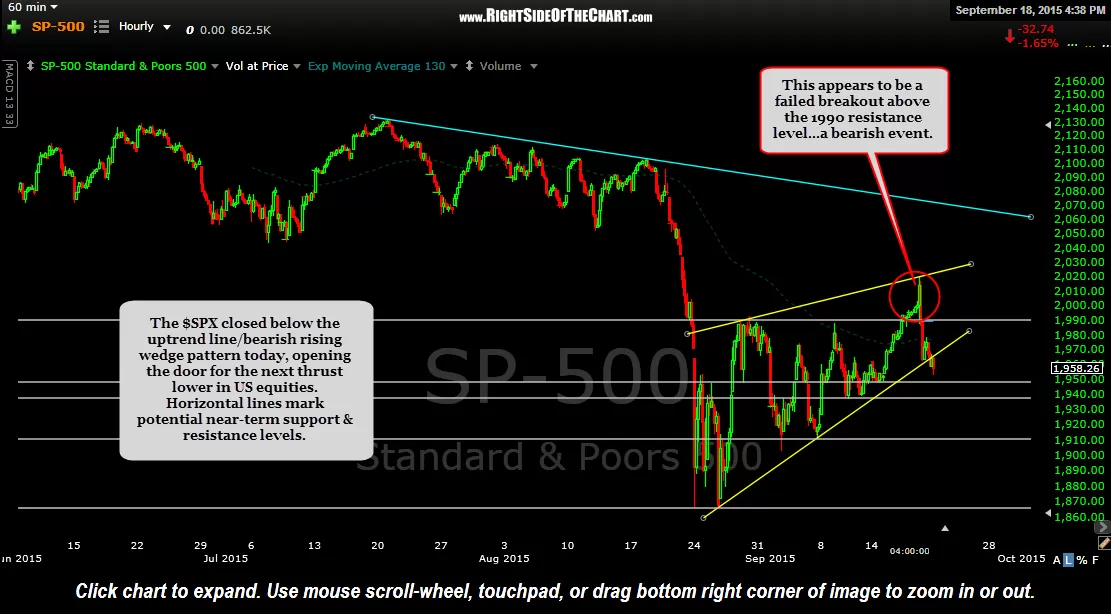
- $SPX 60 minute Sept 18th
-
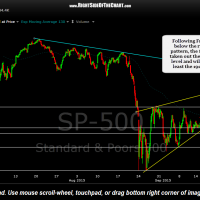
- $SPX 60 minute Sept 22nd
On an administrative note, I continue to work on some programming changes to the site including a new trading room/forum as well as some changes to the menu bar towards the top of the page. You might notice minor changes in appears of the menu bar or other areas of the site but if you experience any issues with functionality (i.e.- you can not access a menu item), please let us know via the Contact Form which is located under the Resources tab of the menu bar.