
I had covered the $VIX (volatility index) along with TVIX in today’s Intraday Stock Market Analysis video but I hadn’t updated the levels on my TVIX chart in a while. As such, here are the daily charts of both TVIX (2x short-term VIX ETN) and VXX (non-leverage short-term VIX ETN) with some key resistance levels which could be used as both levels to initiate or add-to an existing position (if/when taken out) as well as potential price targets on some of the higher marked resistance levels.
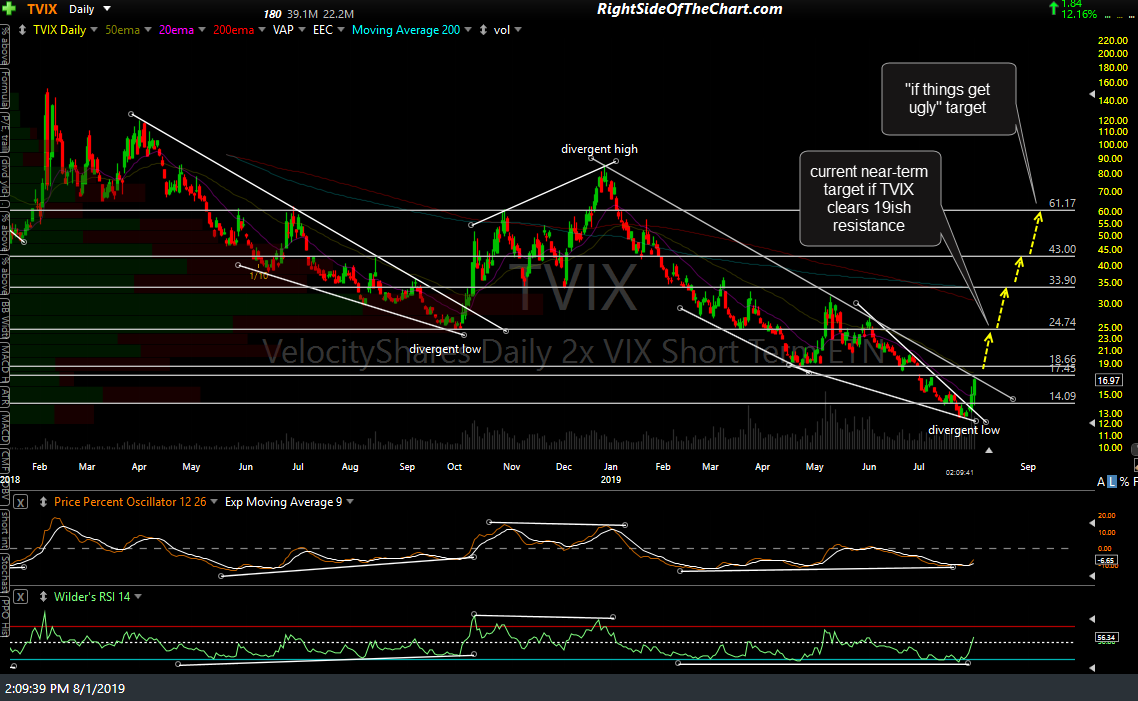
TVIX daily Aug 1st
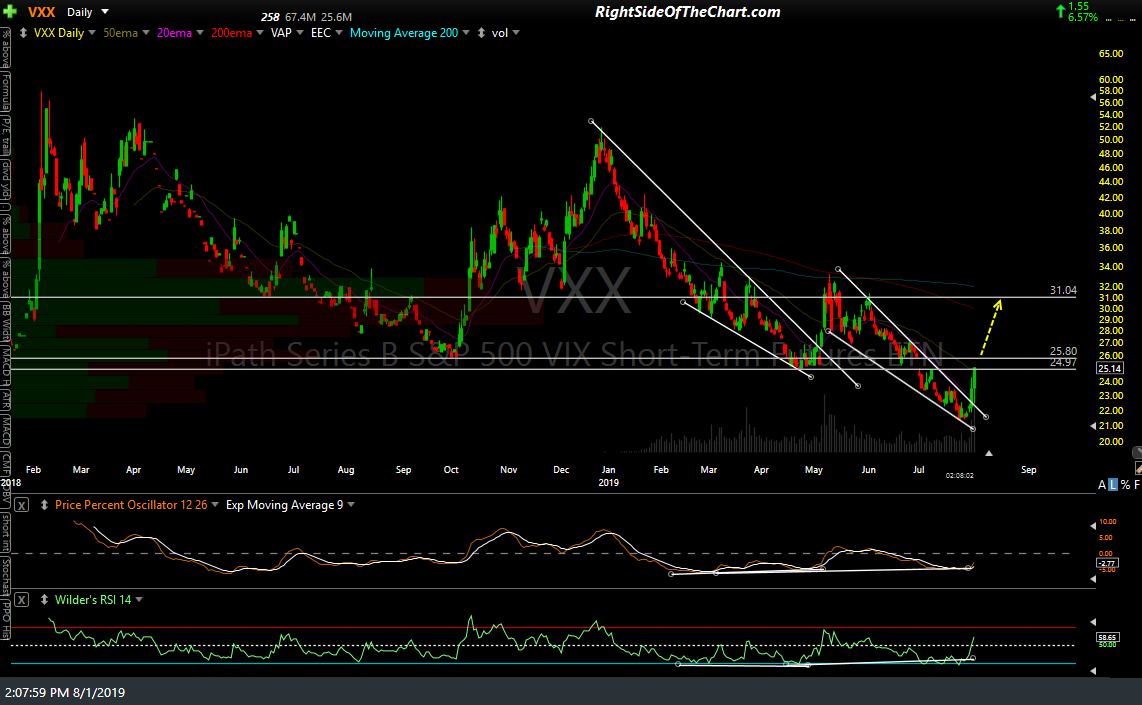
VXX daily Aug 1st
Shortly after that video, making the case for an objective short entry or add-on to a starter short position on the backtest of yesterday’s broken uptrend lines on SPY, QQQ & XLK, was posted earlier, all 3 were rejected off the backtests followed by very impulsive selling which helps to confirm the bearish case. Again, there is still some work to be done in order to firm up the case for a major correction but yesterday’s price action (although Fed-induced) coupled with today’s impulsive rejections off the backtests (although POTUS-induced ) are what they are & as such, technical damage to the charts is technical damage to the charts so until & unless the major indices & the tech sector can undo this recent bearish price action by rallying back above the recently broken trendlines, the odds for a significant correction have only increased so far today.