
Both /ES (S&P 500 futures) and /NQ (Nasdaq 100) have formed a triangle pattern which can break either way with the indicators & recent price action not providing many clues as to how these patterns will resolve. One could make an objective case to go long on an upside breakout of both patterns or short here at the top of the patterns/downtrend lines, with relatively tight stops on both although my preference is to wait and see how the market trades after the open today while waiting for a higher-probability entry regarding any active trades on the indexes. 60-minute charts below.
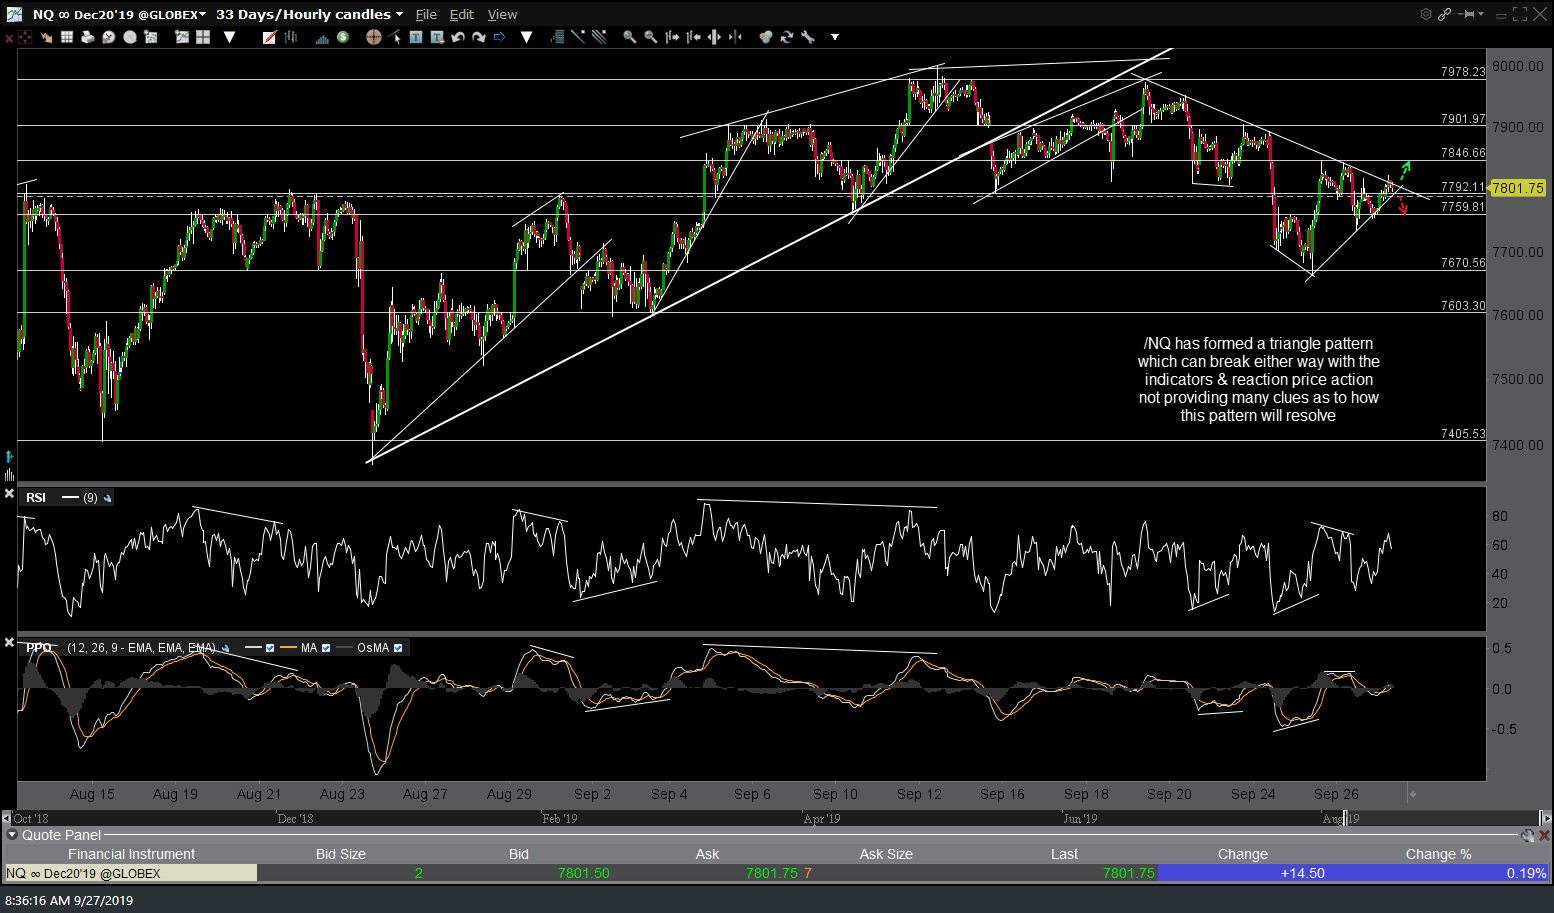
NQ 60m Setp 27th
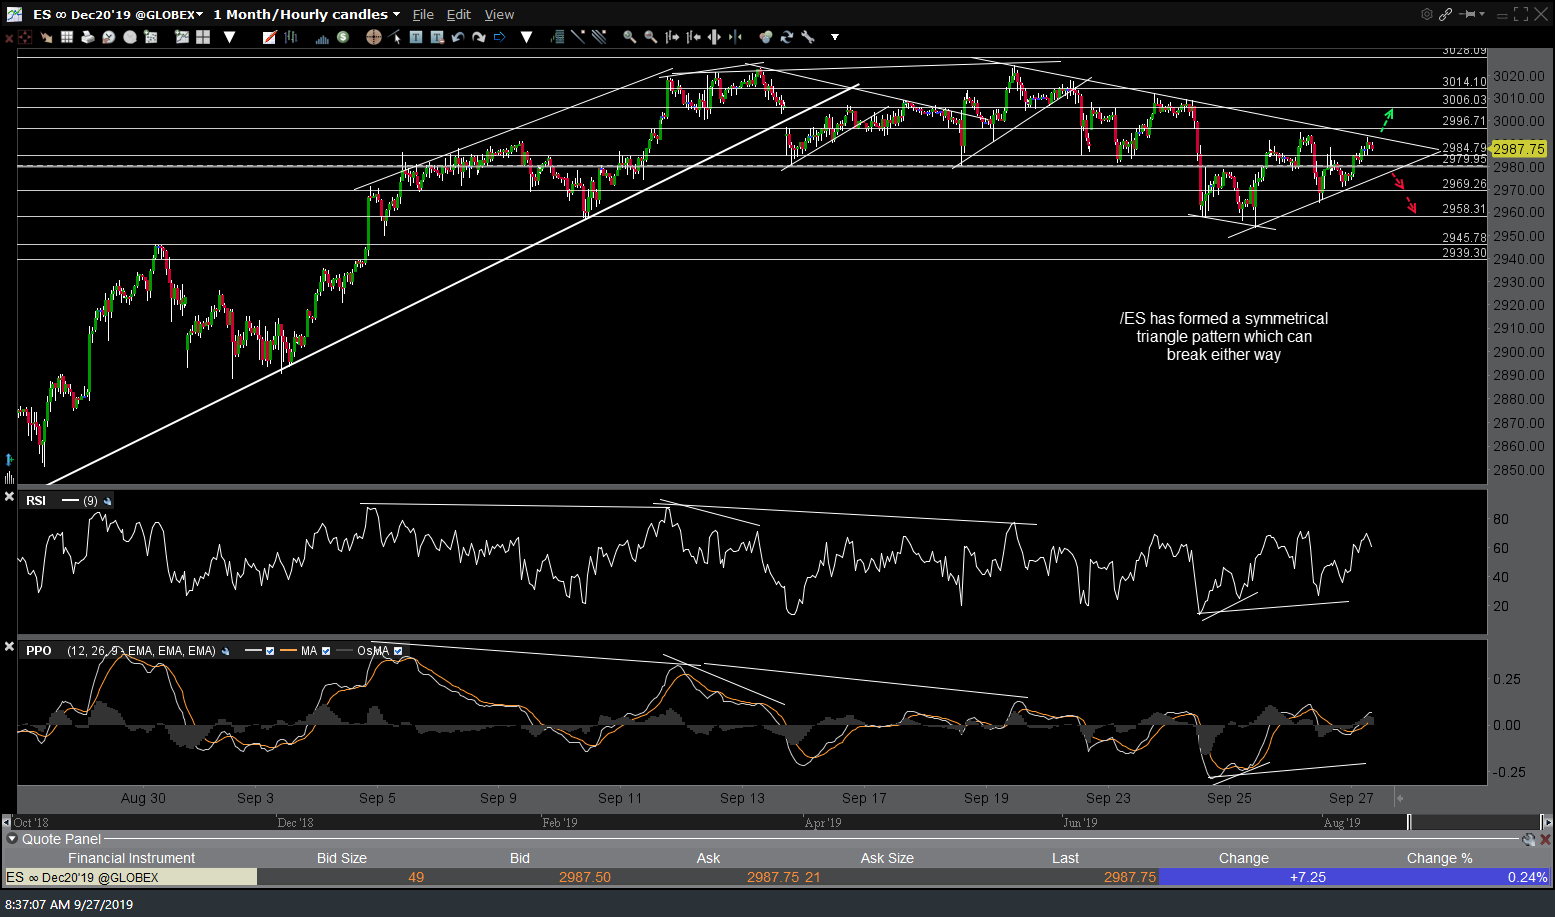
ES 60m Sept 27th