
The TLT (20+ Year Treasury Bond ETF) active Long Swing Trade + Growth & Income Trade closed at 112.00 on Friday, a mere penny above the suggested stop of a daily close below 112.00 (i.e.- a closing print of 111.99 or lower). TLT also went ex-dividend on Thursday, declaring a dividend of 0.274697 to shareholders of record as of November 2nd (Friday), payable on November 7th.
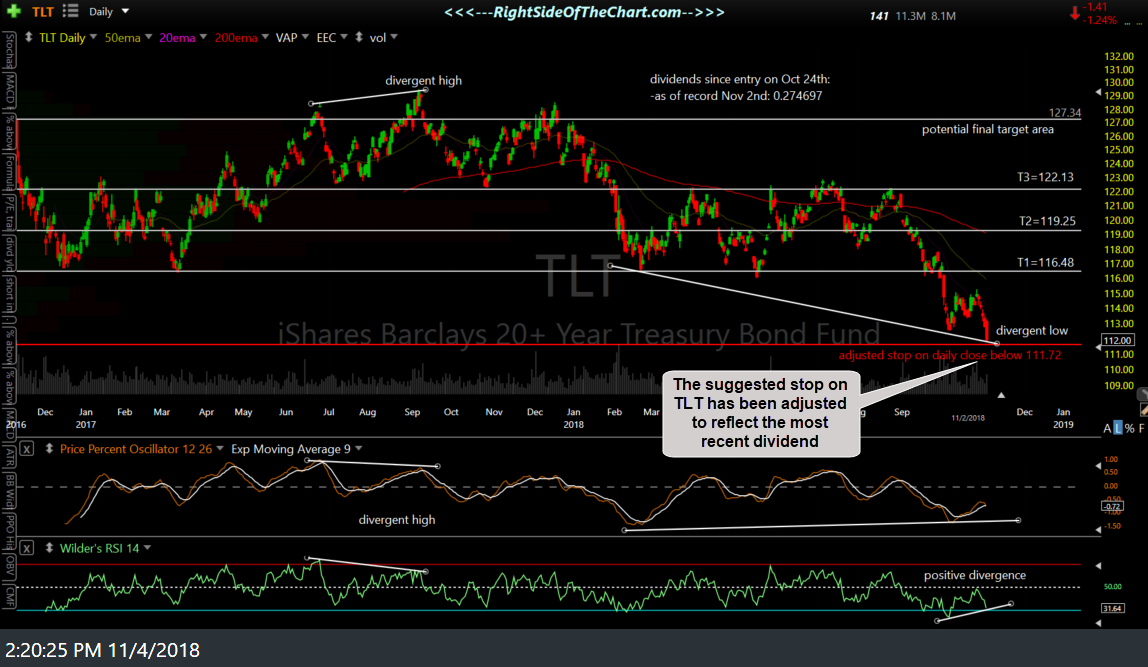
TLT daily Nov 2nd close
Anyone holding TLT on Friday will receive that dividend even if they sell the shares before the payable date. Also, all other things being equal (i.e.- backing out any gains or losses for the day due to natural buying & selling), a stock or ETF will drop in value by the amount of an upcoming dividend on the ex-dividend date.
Based on the entry price of 114.40, the adjusted cost basis for this trade is now 114.125303 (entry price – dividends received). After reviewing the charts on short, intermediate & long-term treasury bonds & yields over the weekend, I am adjusting the suggested to a daily close below 111.72 to reflect the new adjusted basis on this trade. I am also adjusting the stop as I believe the case for a significant & imminent rally in treasuries bonds is even stronger now that it was a when the trade was entered just over a week ago.
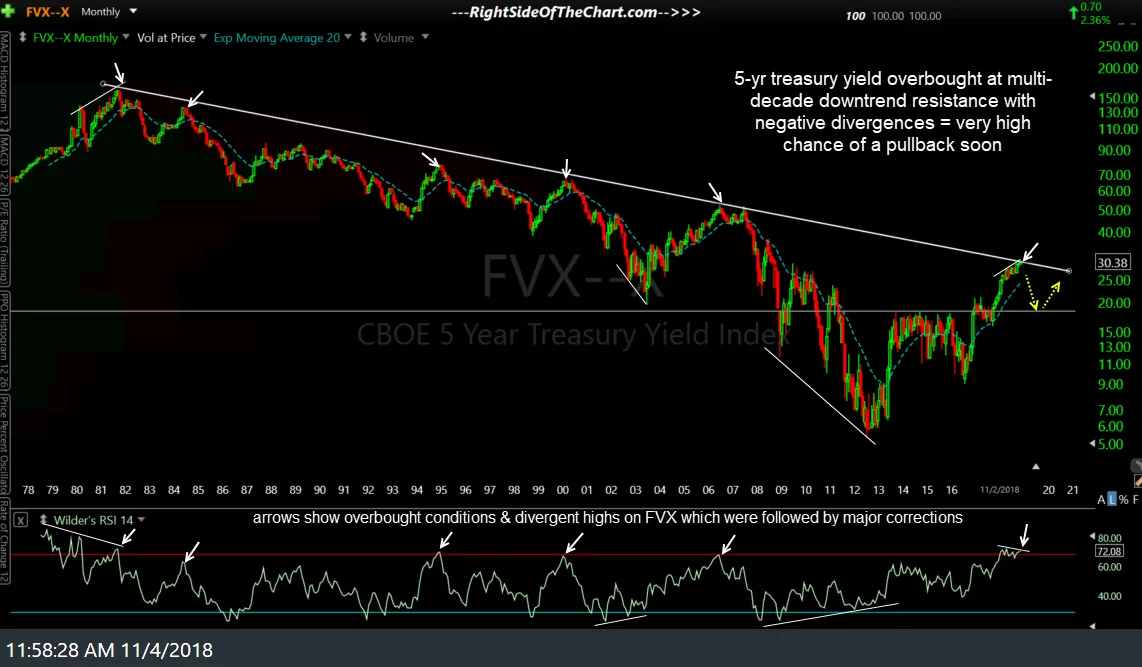
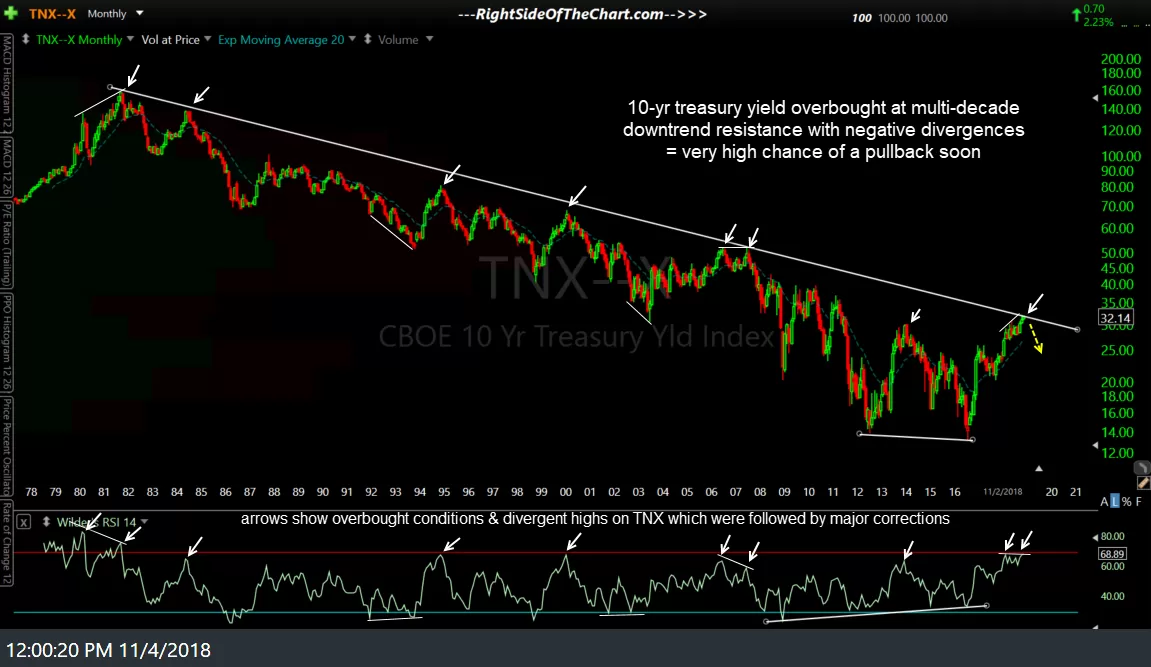
Since entry, yields on short-term (5-year, $FVX), intermediate-term (10-year, $TNX) and long-term (30-year, $TYX) US Treasury bonds have all rallied into very significant multi-decade downtrend lines that start all the way back at the peak of interest rates back in 1981. Not only have rates run into long-term downtrend line resistance but they have done so with divergences & overbought conditions that have marked significant tops in the past as shown on the monthly charts below.
-

- FVX monthly Nov 2nd close
-

- TNX monthly Nov 2nd close
-

- TYX monthly Nov 2nd close
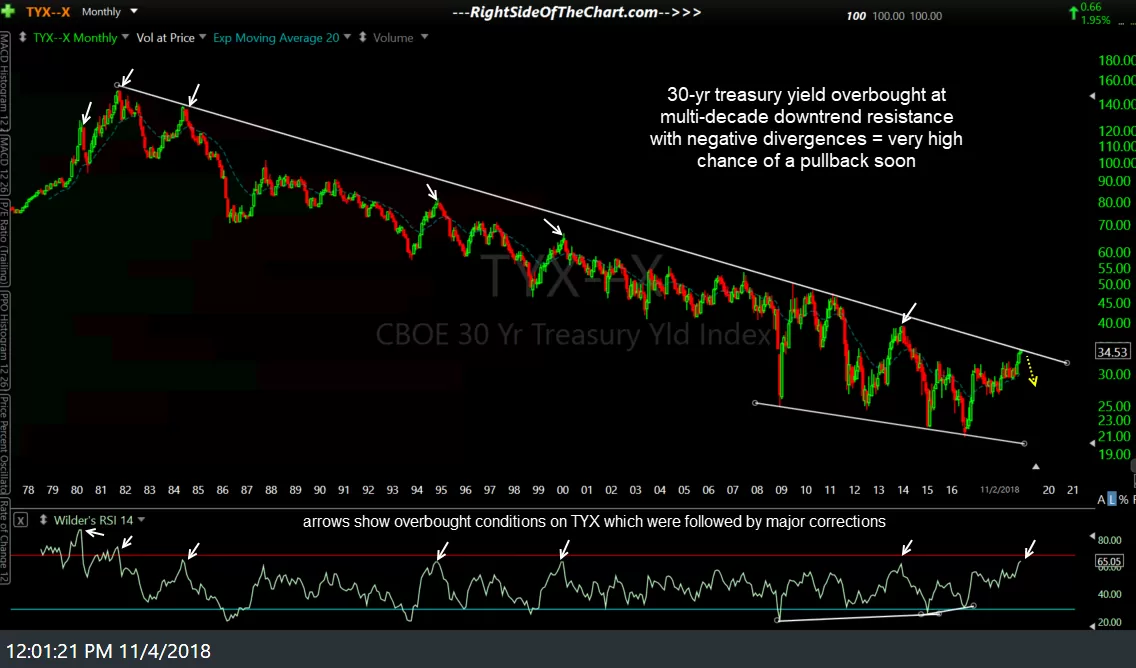
The charts above show US Treasury yields, which move inversely to the bond prices so $TYX (30-year yield) down will always equal a directly proportional upside move in the price of the 30-year treasury bond. While the monthly charts can take some time to play out, this 60-minute chart below shows that TLT closed on a backtest of a recently broken downtrend line with bullish divergences forming on the PPO & RSI which could provide the impetus for a near-term rally & possibly lead to an intermediate-term trend reversal.
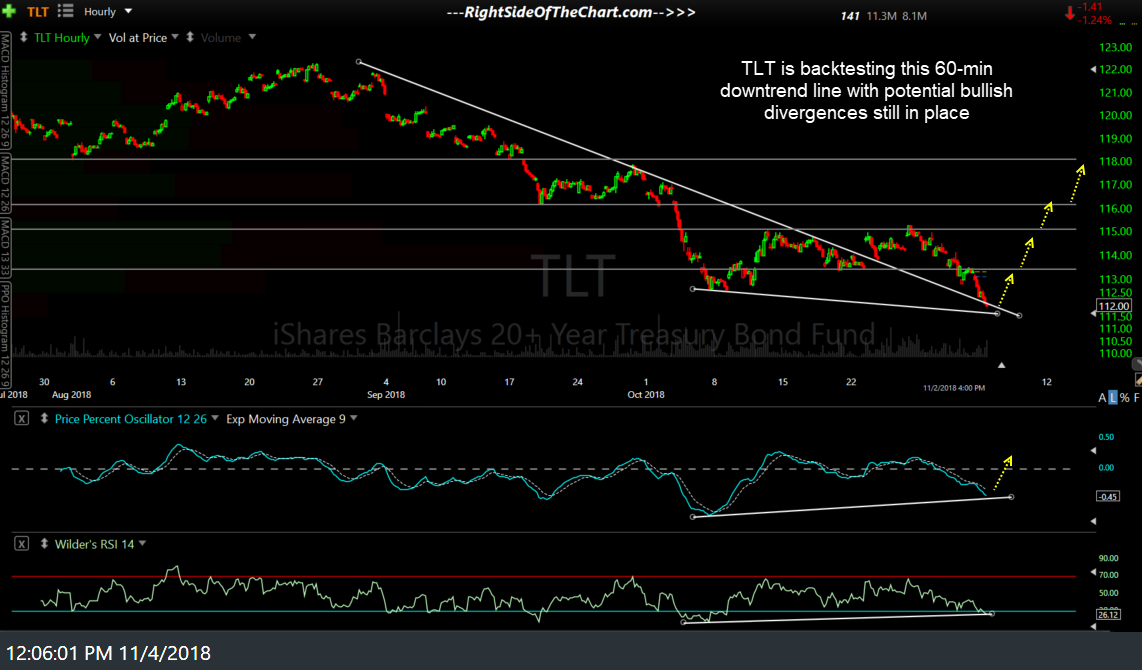
TLT 60-min Nov 4th
Last but not least, keep in mind that TLT is not a “get rich quick” trade idea that has the potential to provide double-digits in very short order like the recent SOXS trade. While an over-weighted position in Treasury bonds could provide a decent total dollar gain for a swing trade lasting a few weeks or months, TLT can also be used as part of a diversified portfolio taking advantage of the benefits of asset allocation as discussed in this recent video, especially during times of increased volatility coupled with the bearish intermediate-term trend & outlook for equities at this time.