
The first chart below is a 4-year, 2-day period chart along with some key technical levels & my analysis on the $TSX (Toronto Stock Exchange/TSX Composite) as requested by member @jiunit23 in the trading room. This leading Canadian index is trading between support (14931) & resistance (15875) following the initial correction off the early January divergent high & subsequent oversold bounce off support. While the near-term outlook is unclear, as of now I favor a continued move down to at least the 14475ish level in the coming months.
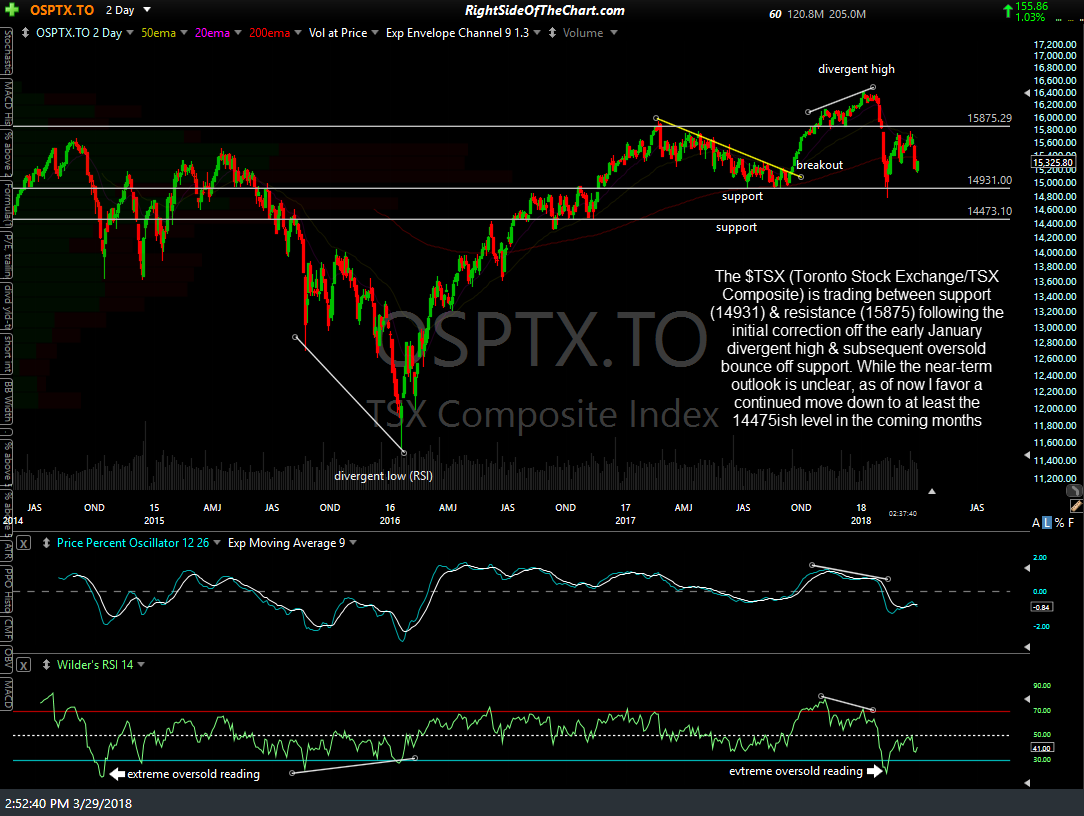
$TSX 4-yr, 2-day chart March 29th
This next chart below is 2-year chart using daily candles with the same key levels while highlighting the fact that the PPO signal line, which does a good job of defining bullish & bearish trends while above or below its respective zero line, was recently rejected on a backtest of the zero line from above, keeping that trend indicator on a sell signal since the bearish zero line cross on February 2nd.
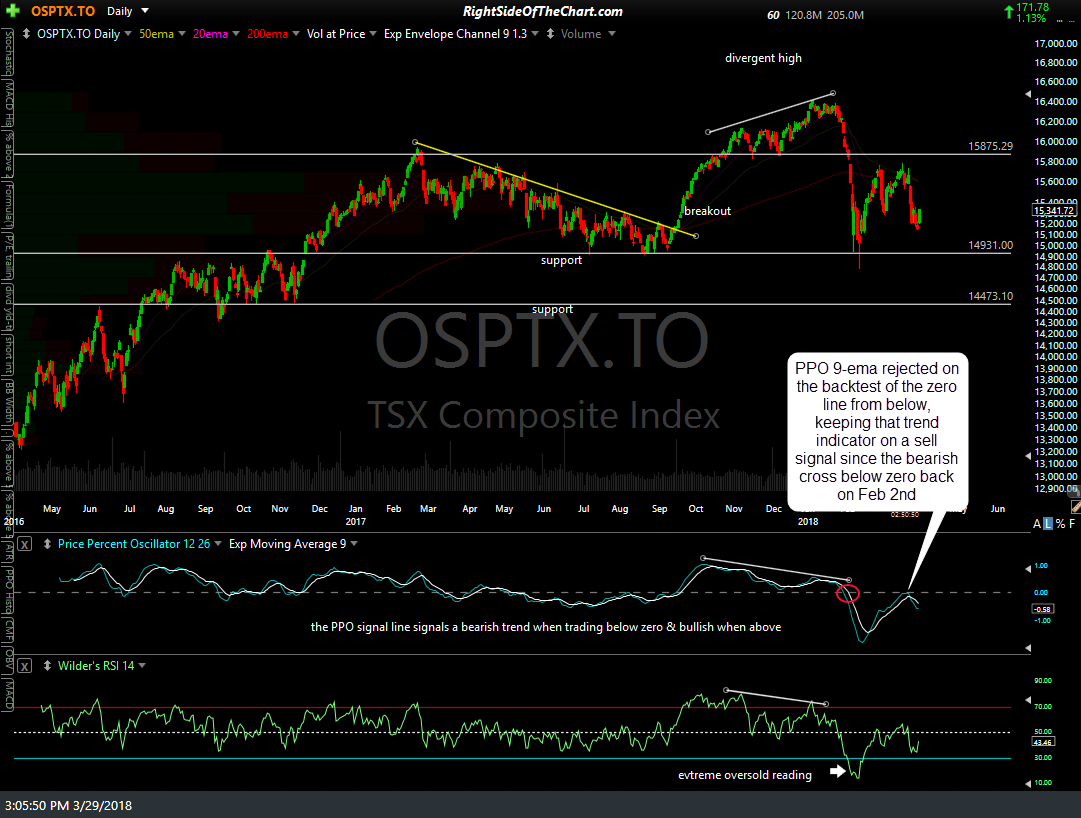
$TSX daily March 29th