
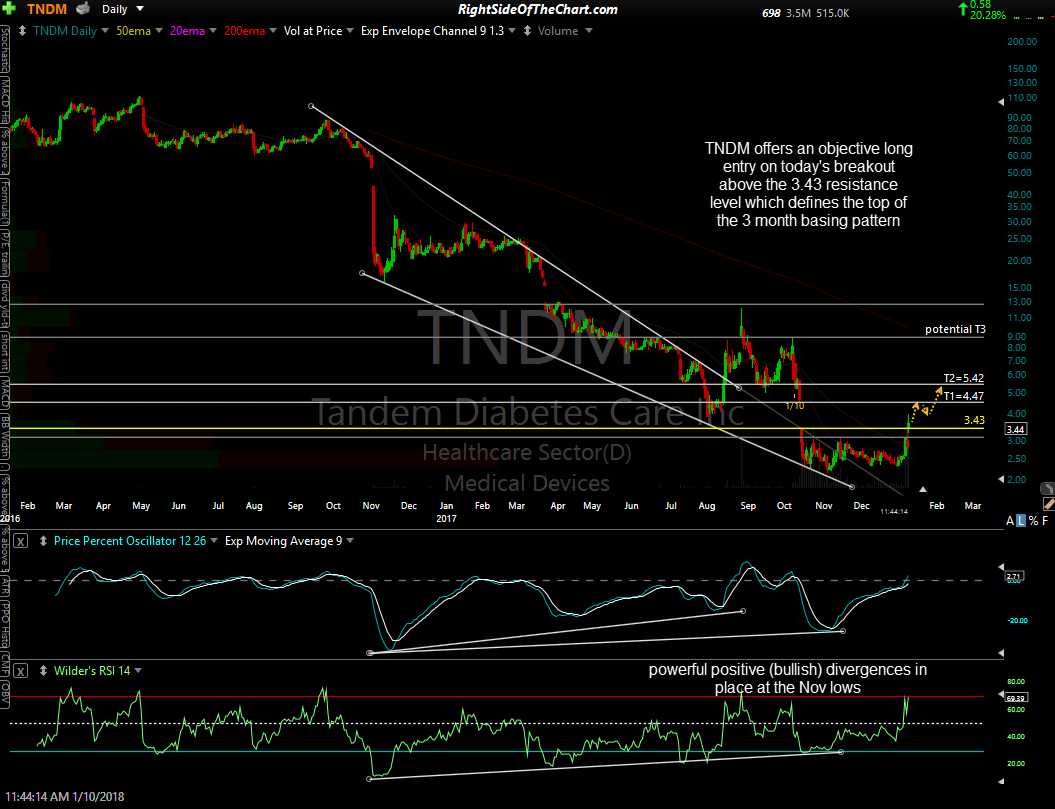
TNDM (Tandem Diabetes Care Inc.) offers an objective long entry on this breakout above the 3.43 resistance level & will be added as both an Active Long Swing Trade as well as a Long-term Trade idea around current levels. The price targets are T1 at 4.47 & T2 at 5.42 with the potential for a third target around the 9.00 area, depending how the charts develop going forward. The suggested stop is a daily close (one can also use the 3:59pm ET price) below 2.90* with a suggested beta-adjusted position size of 0.60. The optimal entry is anywhere as low as 3.10 to as high as 4.00. The stock is currently trading at 3.44, just above the key 3.43 level which defines the top of the basing pattern as well as the bottom of the large Oct 13th gap.
TNDM daily Jan 10th
The catalyst for today’s breakout was last night’s positive earning report & forward guidance provided by the company, the details of which can be viewed by clicking here. TNDM is a low-priced medical device company that designs, develops, and commercializes various products for people with insulin-dependent diabetes in the United States. The stock has been & still is in a vicious bear market that has wiped out over 99% of the company’s stock price since shortly after it started trading back in late 2013. As such, this should be considered a very aggressive, borderline speculative trade.
On that note, it is my speculation that Tandem could be a potential take-over candidate but this trade is based primarily on the recent technical developments, most notably the fact that TNDM has impulsively broken out above what appears to be a 3-month basing pattern following a powerful divergent low. As always, DYODD and pass on any trades that do not mesh with your unique investment/trading objective & risk tolerance.
*The suggested stop of a daily close below 2.90 is based on both the technicals (support) as well as a favorable R/R of slightly better than 3:1. Those only targeting T1 might consider a higher stop.