
While TLT (20+ yr Treasury bond ETF) already triggered a long entry on the 60-minute chart shortly after it was posted as a Trade Setup last week, it will also trigger another buy signal/objective long add-on with a solid break above this bullish falling wedge on the daily time frame with a current target just below the 91.92 resistance level.
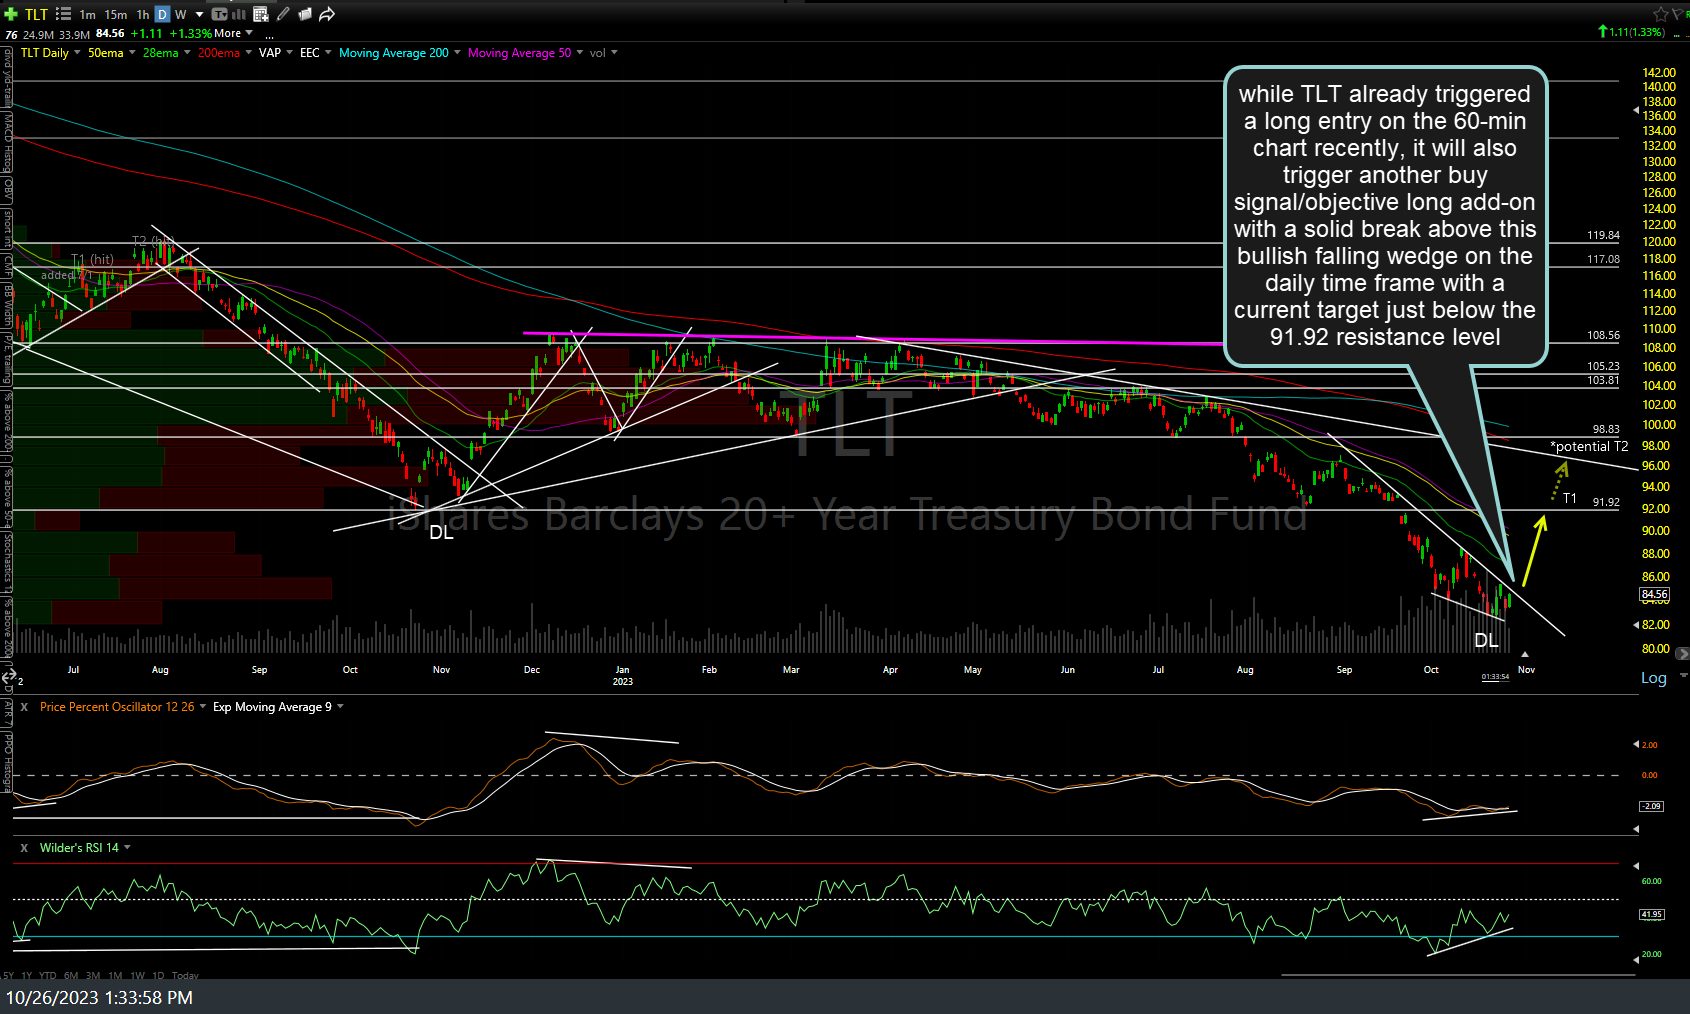
TLT daily Oct 26th
That sole target of 91.90ish on the daily chart above would be for typical swing traders, providing about a 10% (non-beta-adjusted*) profit, if hit, while more active swing traders might opt to use the price targets on the 60-minute charts of TLT & /ZB (posted in the setup last week). Previous (last Thursday’s /ZB & TLT) & updated 60-minute charts below.

ZB 60m Oct 19th

TLT 60m Oct 19th
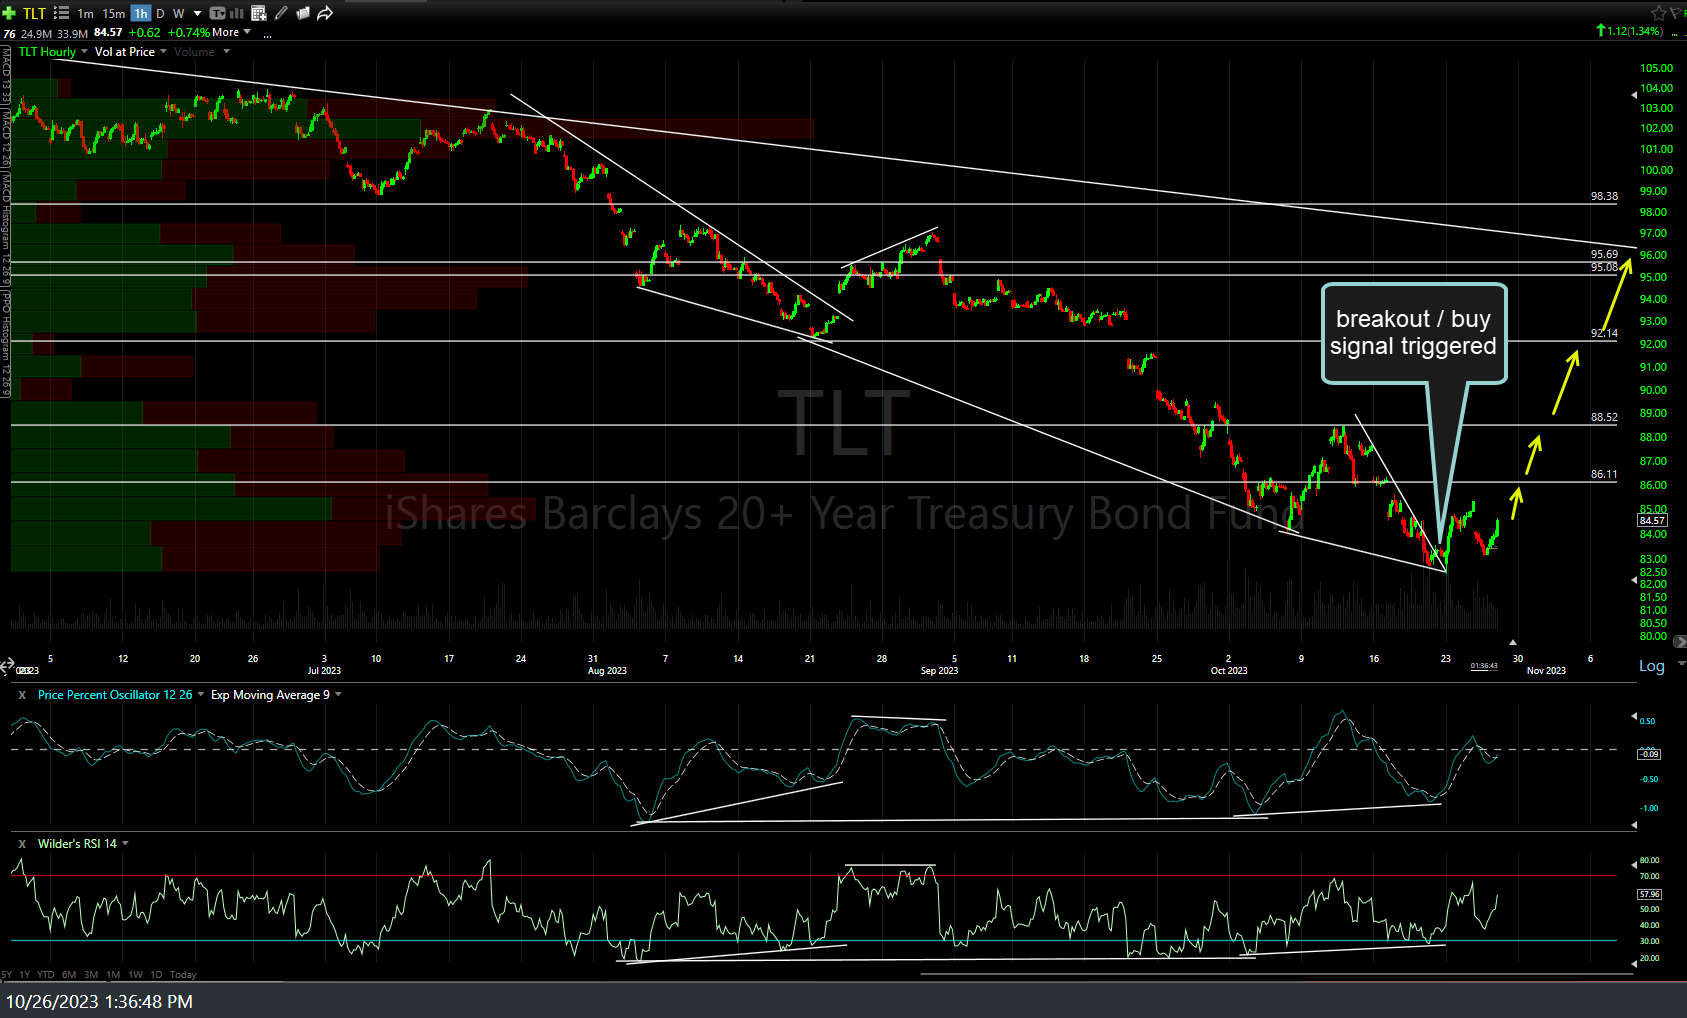
TLT 60m Oct 26th
* Due to the relatively low (relative to the stock market) volatility of US Treasury bonds, the suggested beta-adjusted position size for this trade when posted last week was 2.0 or 2x a typical position on the S&P 500. As such, a 10% gain on TLT would equate to a comparable 20% gain a stock index tracking ETFs such as SPY.