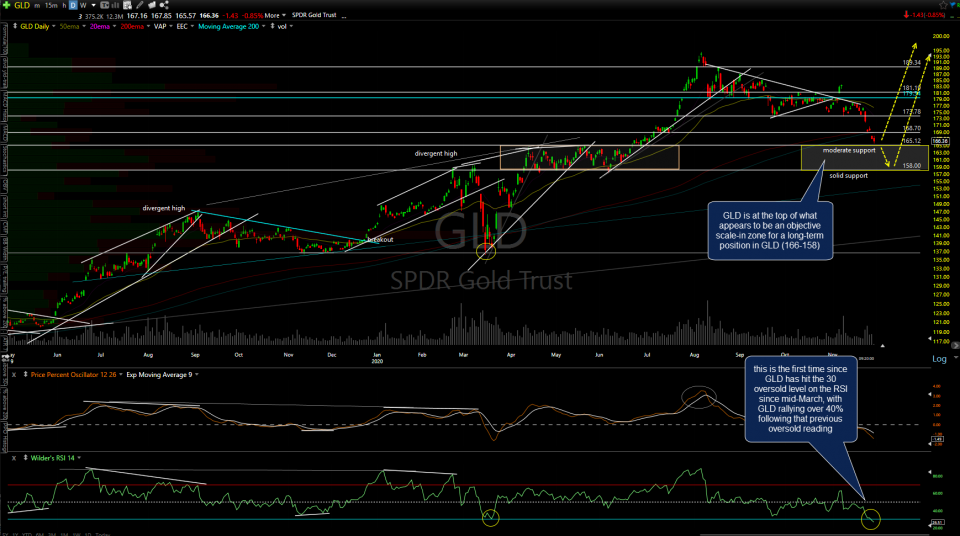
GLD (gold ETF) is at the top of what appears to be an objective scale-in zone for a long-term position in GLD (166 down to 158). This is also the first time since GLD has hit the 30 oversold level on the RSI since mid-March, with GLD rallying over 40% following that previous oversold reading. Daily chart below.
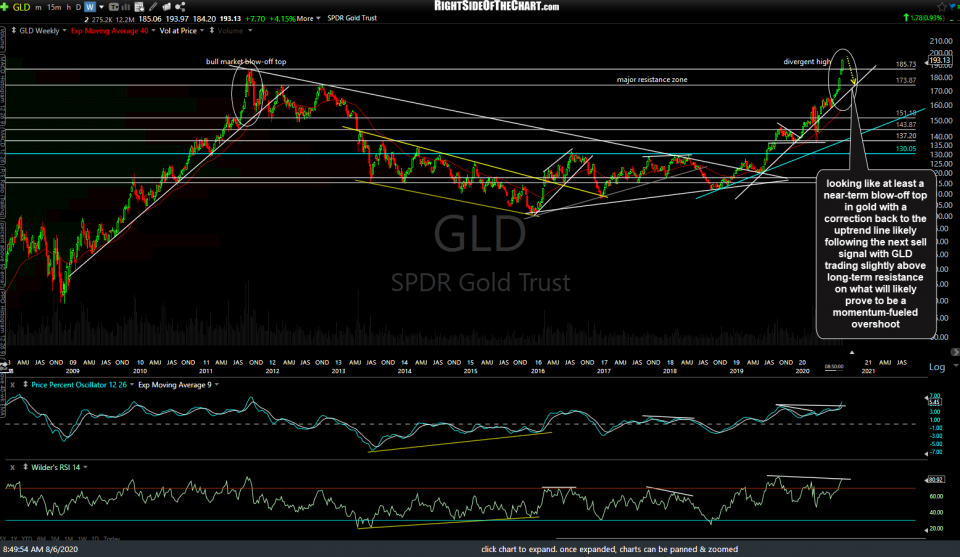
The first weekly chart below from August 6th calling for a correction in gold with what appeared to be at the time (and since proved to be) at least a near-term blow-off top.
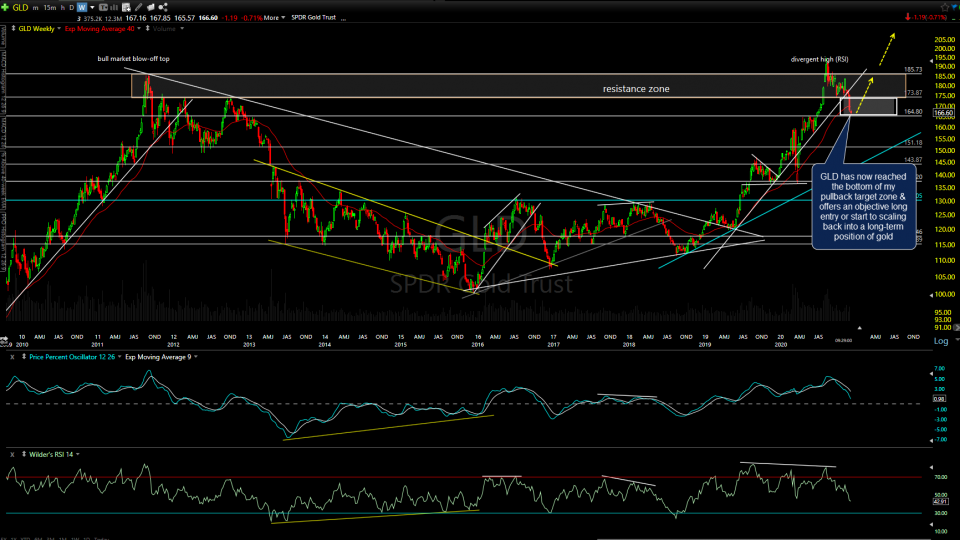
On the weekly chart below posted back on Sept 25th (as well as several videos before & after that), I highlighted my pullback target zone of 173.87-164.80 in GLD.
On the updated weekly chart below, GLD has now reached the bottom of my pullback target zone & offers an objective long entry or start to scaling back into a long-term position of gold.
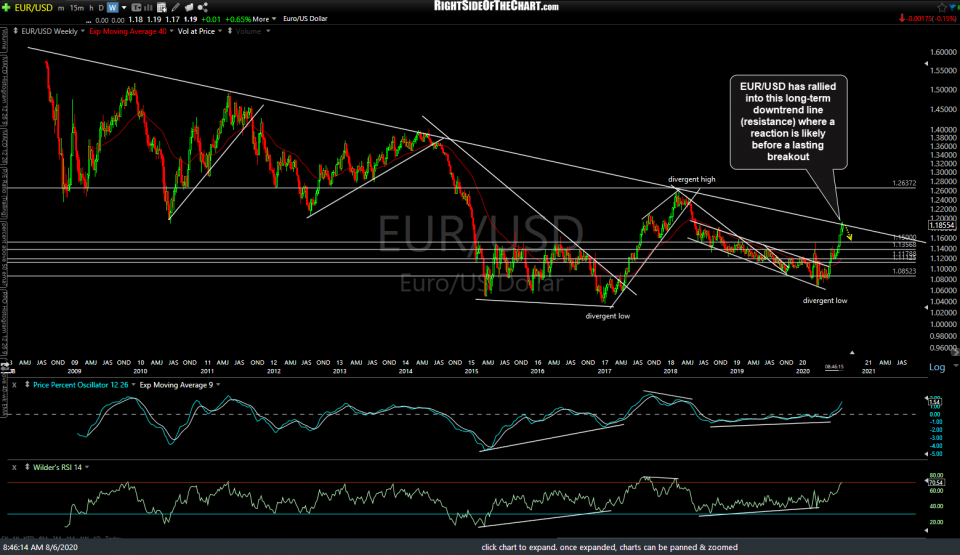
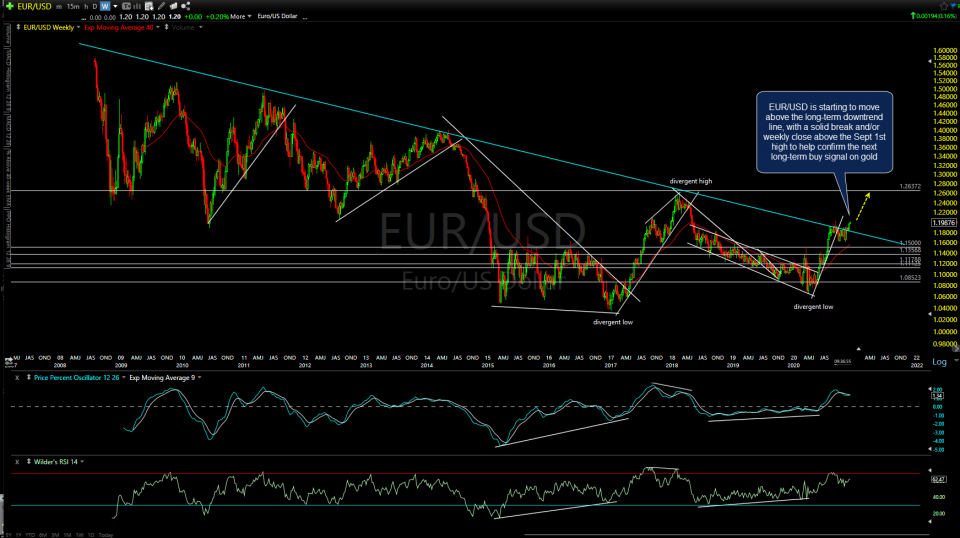
To help support the case for a correction in gold while the metal, as well as the Euro, were both solidly entrenched in one of their strongest rallies in years, I highlighted the fact that the EUR/USD was trading at long-term downtrend line resistance with a reaction likely.
After pulling back off that trendline & consolidating for the past 4-months, EUR/USD is starting to move above the long-term downtrend line. A solid break and/or weekly close above the Sept 1st reaction high will help to confirm the next long-term buy signal on gold.
Bottom line: This isn’t a “hard” buy signal on gold nor a breakout on gold. This is a pullback to support which appears to be an objective time to start scaling back into long-term positions in gold and the related mining stocks for long-term trend traders & investors that may have taken profits on those long-term positions 4-months ago & side-stepped any or all of the 15% correction in gold & 30% correction in GDX.


