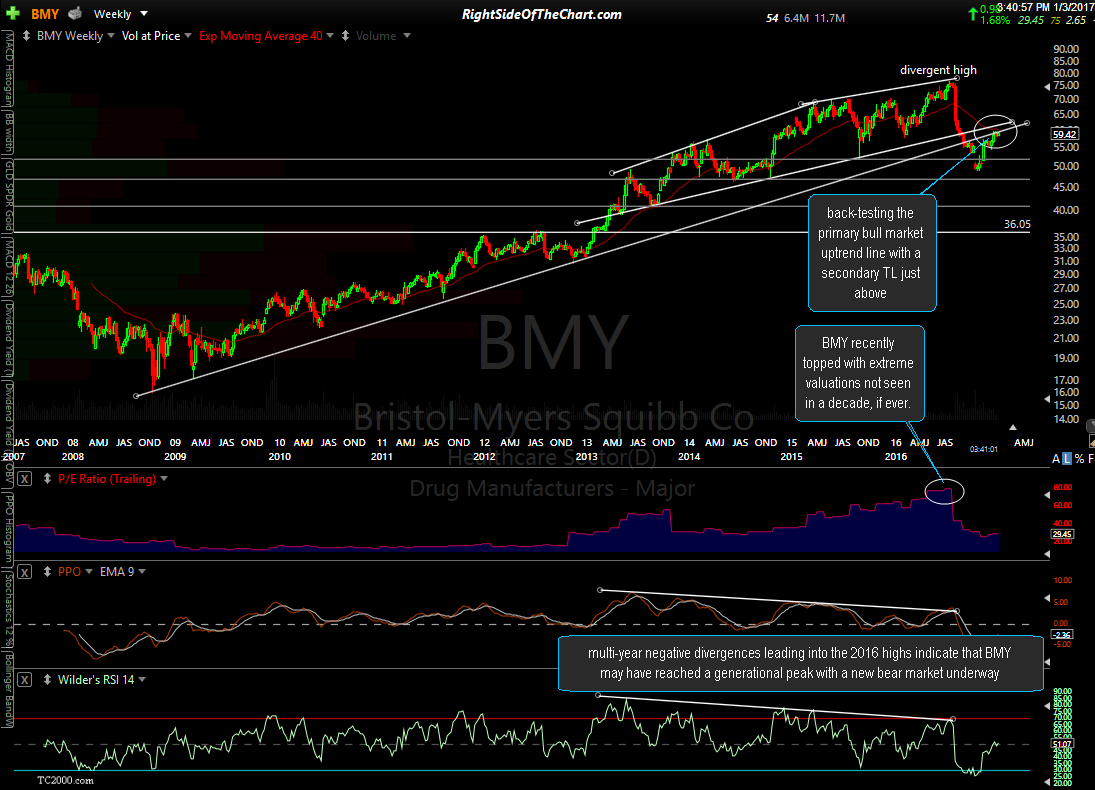
Member @Ruben asked for my opinion on BMY (Bristol-Myers Squibb) and GILD (Gilead Sciences) in the trading room & as there are some pretty clear technical developments on both, I figured it would be worth sharing the charts for anyone else interested. In fact, as these two companies are in closely related and somewhat overlapping industries, the analysis of these two companies, with completely diverging outlooks, speaks to the benefits of security selection (individual stock picking) vs. individual sector or broad market investing.
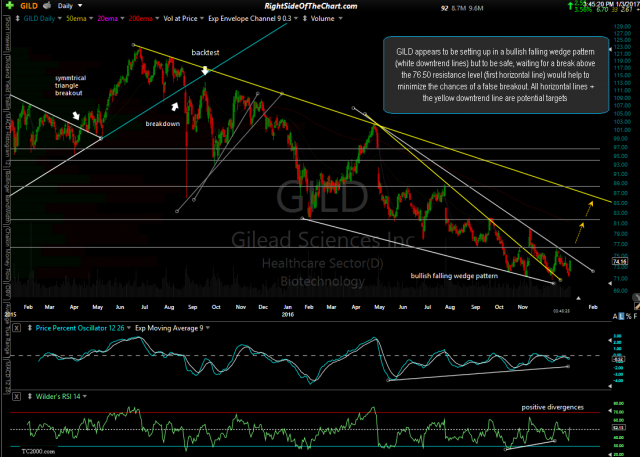
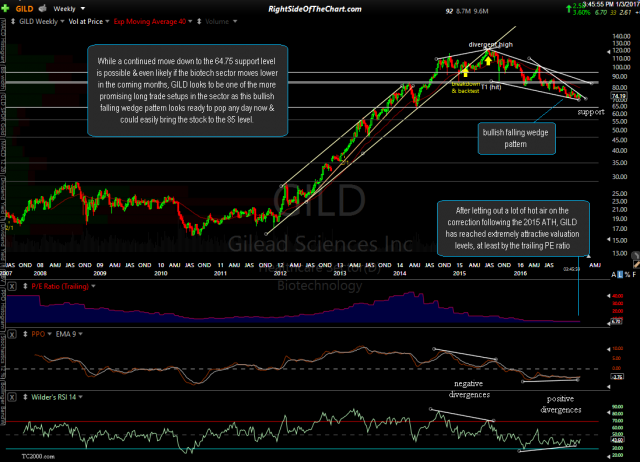
GILD appears to be setting up in a bullish falling wedge pattern, confirmed with positive divergences on both the daily & weekly time frames. The falling wedge shows well on both of these charts (with the white trend lines on the daily) and any or all of the horizontal lines on the daily chart are potential price targets, should GILD make an convincing/impulsive breakout above the wedge pattern. Gilead also appears to be very reasonable valued, with the P/E ratio at multi-decade if not all-time lows following the 42% price drop since the 2015 highs. Trailing P/E ratios are only one of many metrics use to value a company so it would be prudent to DYODD on the fundamentals of GILD if considering a long-term trade or investment in this biotech stock.
- GILD daily Jan 3rd
- GILD weekly Jan 3rd


