
Member @up asked for my thoughts on the EUR/USD (Euro/USD currency pair). As the largest component of the US Dollar index with a 57.6% weighting, the Euro has the largest impact on the US Dollar index by far & as such, I will often use the EUR/USD chart to help determine where the US Dollar, along with dollar sensitive assets, such as gold & crude oil, might be headed.

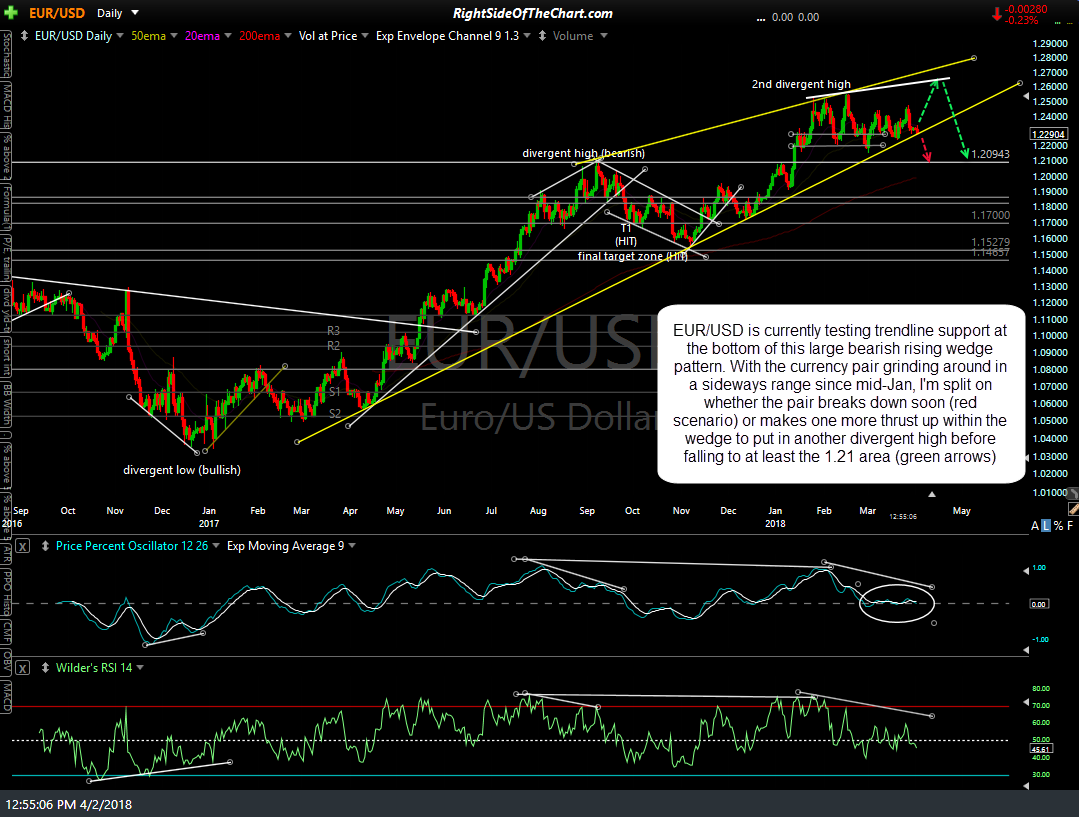
EUR-USD daily April 2nd
EUR/USD is currently testing trendline support at the bottom of this large bearish rising wedge pattern on the daily chart above. With the currency pair grinding around in a sideways range since mid-Jan, I’m split on whether the pair breaks down soon (red scenario) or makes one more thrust up within the wedge to put in another divergent high before falling to at least the 1.21 area (green arrows).
EUR-USD daily April 2nd
The primary reason that I’m unsure of whether on not the €/$ will bounce off or break below support here is the fact it has been grinding around in a sideways trading range since mid-Jan, with little clues to the next direction on this 4-hour period (candlesticks) chart above as the momentum indicators essentially become useless during sideways trading ranges. As such, the next trend in the pair is likely to be determined by a break above or below the range although a break & solid close below the uptrend line on the daily chart would trigger a sell signal which would be bullish for the US Dollar & bearish for the Euro.