
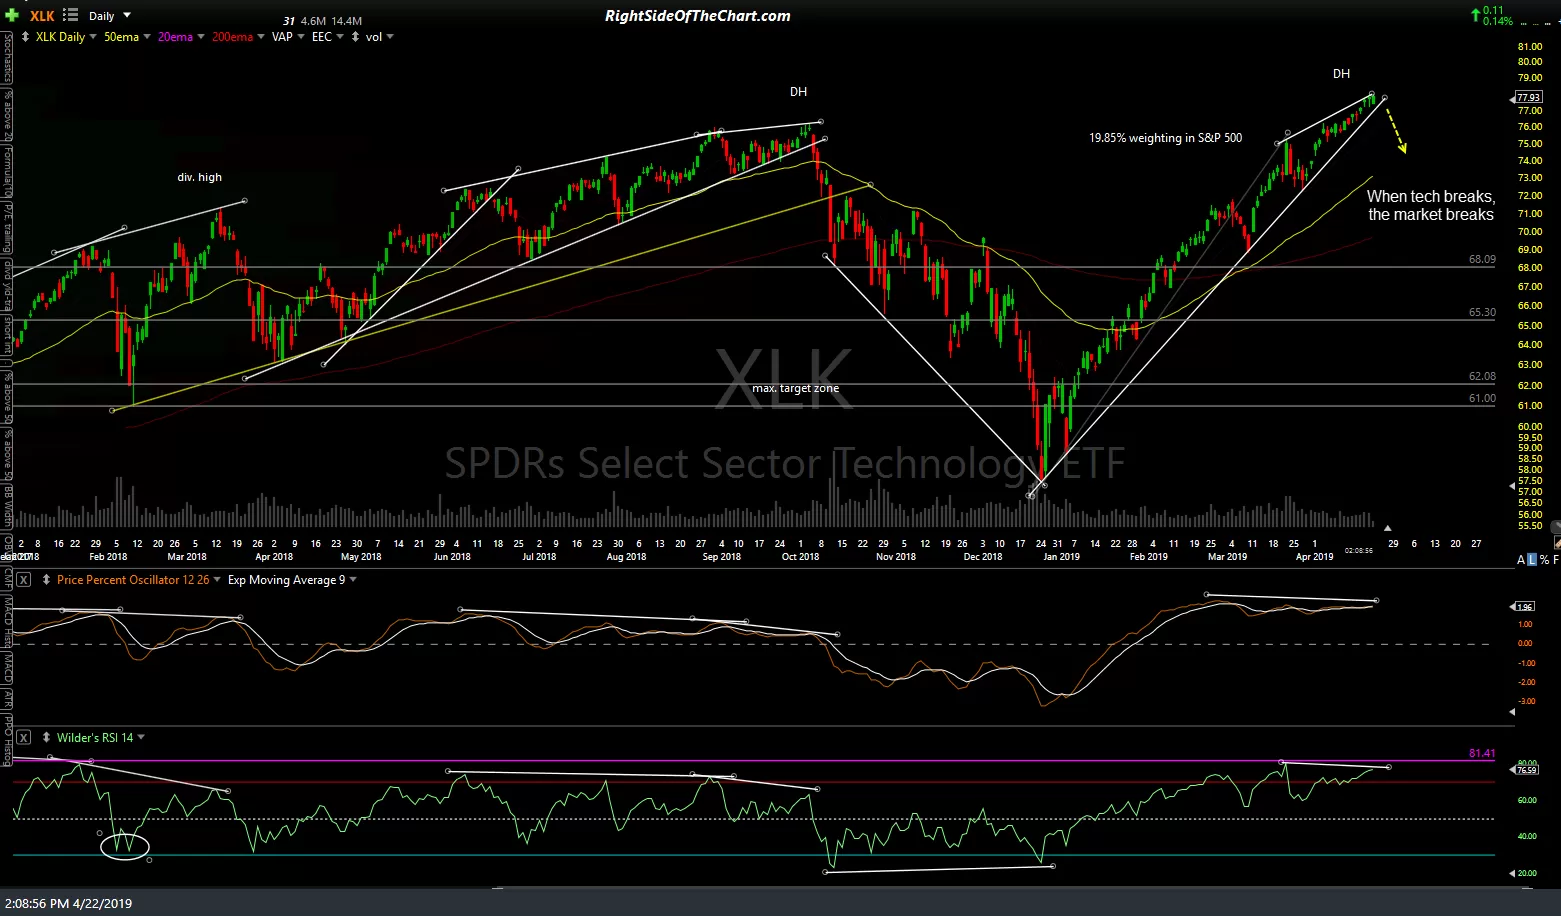
As I’ve often stated, “when tech breaks the market breaks” due to the fact that the technology sector is, by far, the largest sector in both the Nasdaq 100 as well as the S&P 500. In fact, all 3 of the major corrections over the past year were clearly identified well in advance as well as at shortly after they started with sell signals triggered on breakdowns below well-defined uptrend lines following divergent highs.
The first chart below from April 22nd was posted just 7 trading sessions before the tech sector peaked on May 1st, breaking down below that uptrend line the following day & thereby providing a solid & clear sell signal for the 12% drop into the early June lows with the second chart highlighting the last objective short entry before the 9% drop into the August 5th lows when XLK was backtesting the trendline from below after the impulsive breakdown the day before. The third chart is today’s chart showing that XLK has now rallied to the bottom of the 79.50-83-30 former resistance, now support zone which is the level where the July breakout to new all-time highs both occurred & then failed shortly afterwards, thereby confirming the bull trap scenario which was laid out back before & after the July breakout to new highs.
-

- XLK daily April 22nd
-
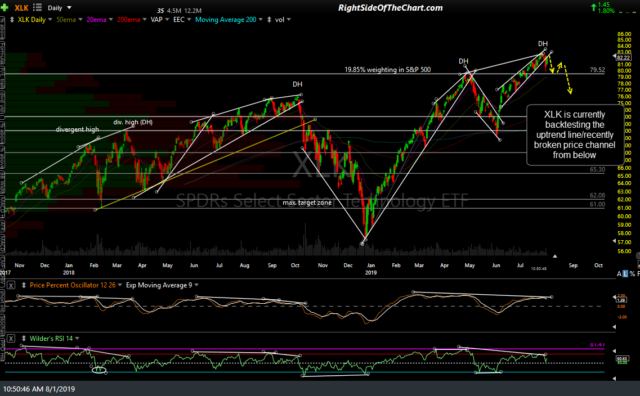
- XLK daily Aug 1st
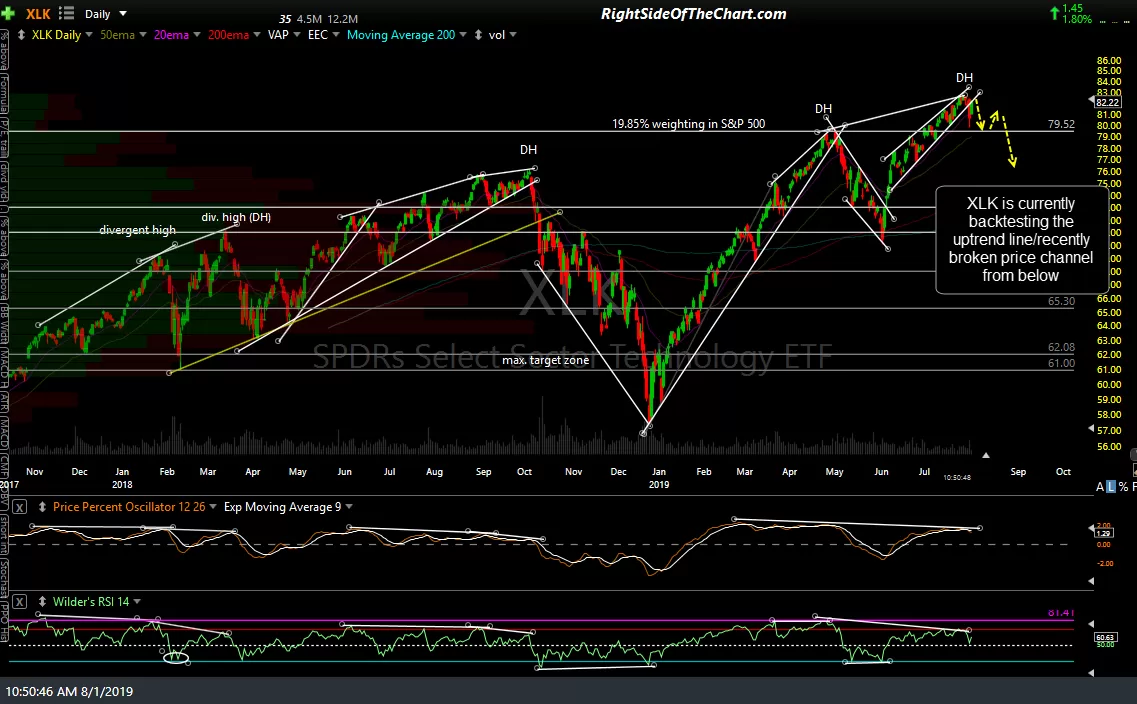
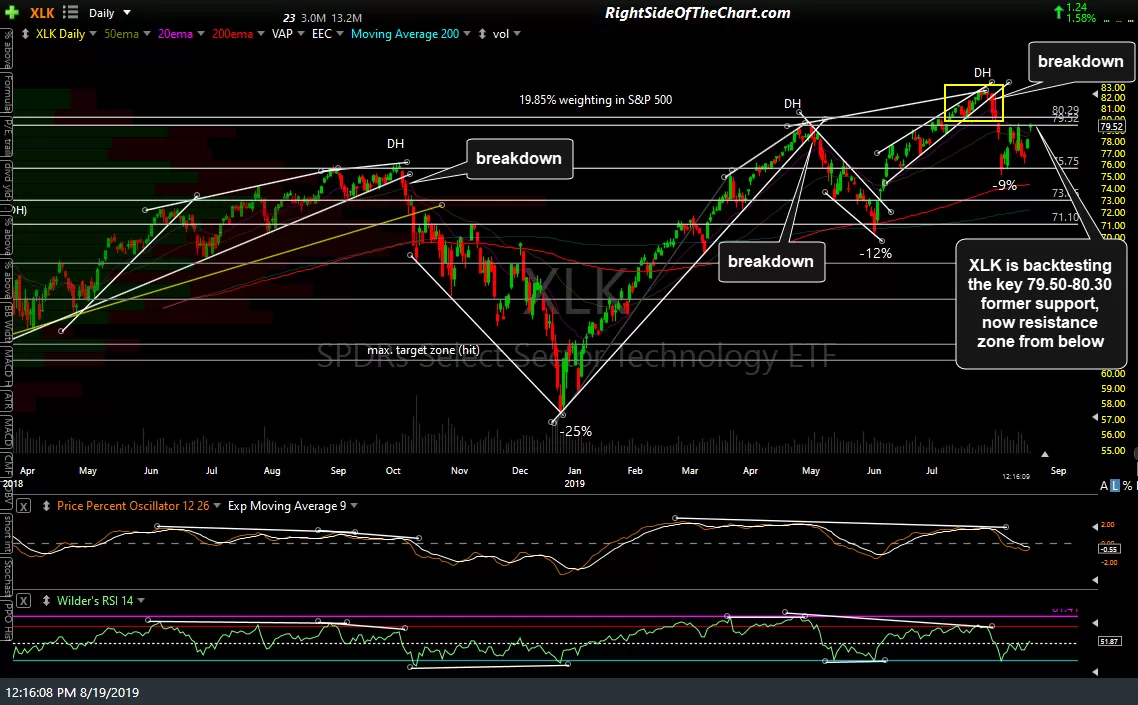
The most recent sell signal came on the impulsive trendline break on July 31st with another objective short entry on the backtest of that trendline the following day, with the tech sector (XLK) falling 9% (so far) off that previous all-time high. The big question is “Was that recent 9% drop the end of the correction that was already priced into the charts or was it just the first leg down within a much larger drop with the next leg down soon to come?” While only time will tell, I can say that just as with the major stock indices (as pointed out earlier today), XLK has rallied back to once again make another test of a very technically significant resistance zone and as such, this appears to be a key battleground for the bulls & the bears.
So what does this all mean? Well, the answer to that questions depends on who’s asking it. Those that are bullish looking for the market to rally up to & beyond the previous highs might look to initiate or add to long positions on a solid break above this resistance zone on XLK as well as the aforementioned resistance levels on both SPY & QQQ. Those currently short might be concerned with where they plan to stop out, should the markets continue much higher from here while those bearish but not yet short or only partially short might opt to add short exposure here at resistance with stops somewhat above, ideally on a daily closing basis.
Finally, those unsure what to do might do best standing aside or at least keeping things light for now to let the bulls & bears slug it out at this key battleground & wait to see which team claims victory before choosing sides. Of course, I should caution that in a volatile market such as this, false breakouts in either direction are fairly common so please don’t interpret this to be an all-or-none “the market is headed much higher if it continues to rally much above today’s highs or headed much lower in the coming weeks if it reverses or closes below today”.