
The 60-minute charts below list some of the near-term support levels to watch on the major stock index ETFs (SPY & QQQ) and futures (/ES & /NQ), along with some potential price targets, should they trigger near-term sell signals as outlined below.
Click the first chart to expand. Once expanded, charts can be panned & zoomed for additional detail.
-

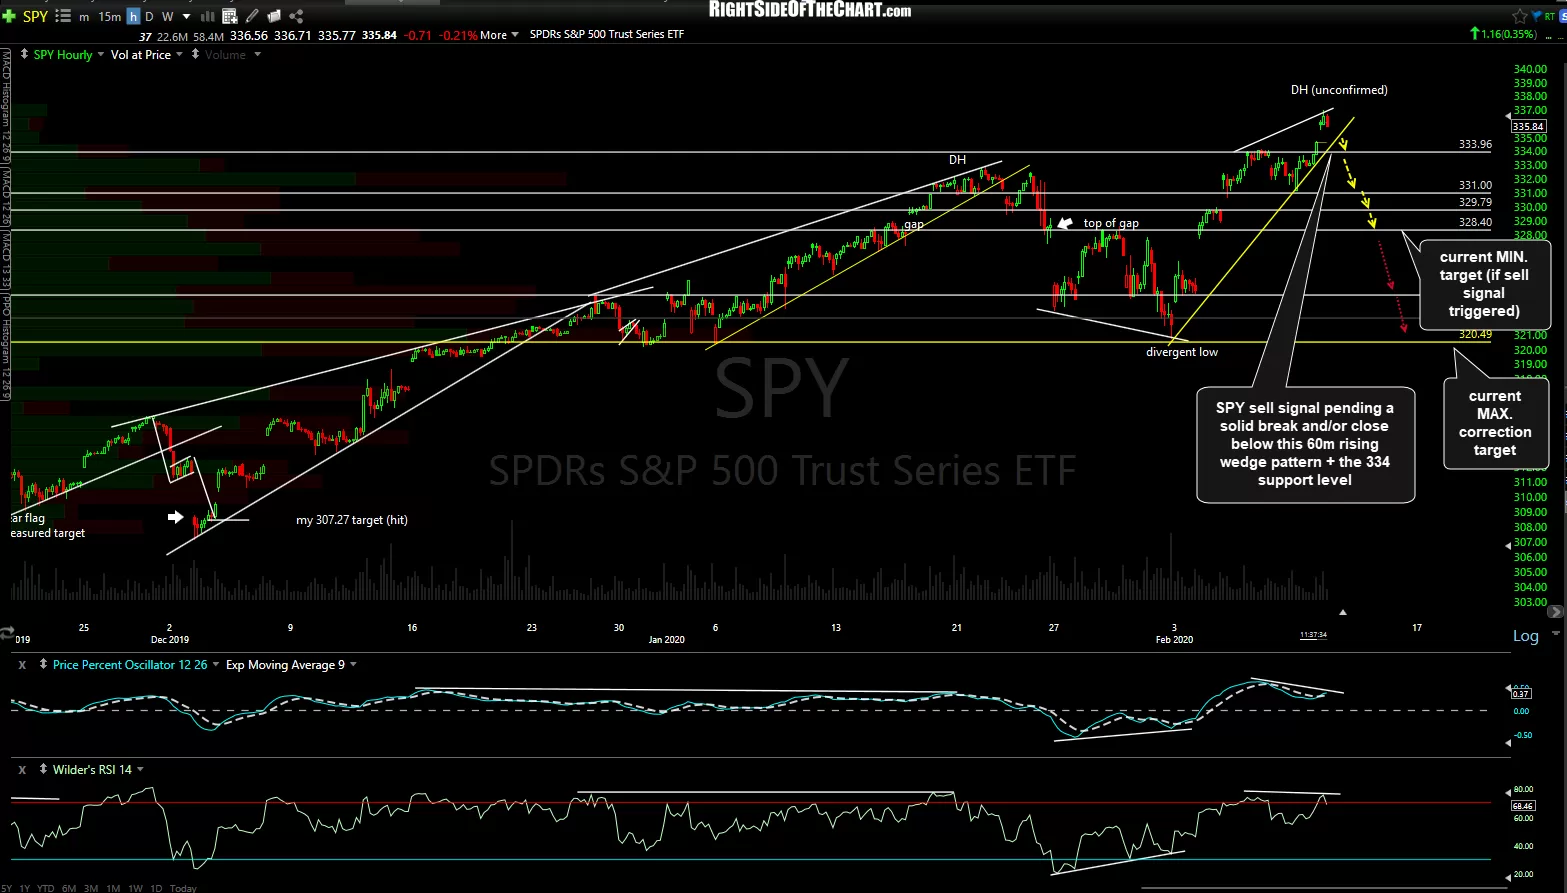
- SPY 60m Feb 11th
-
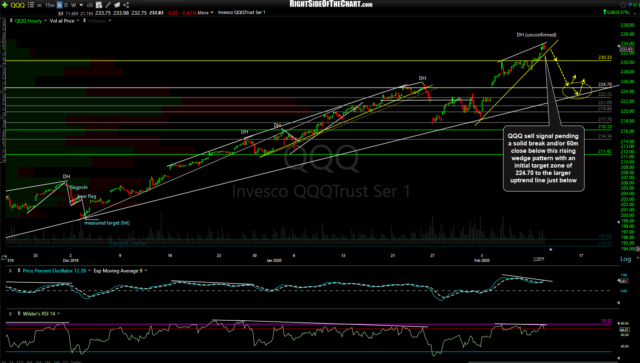
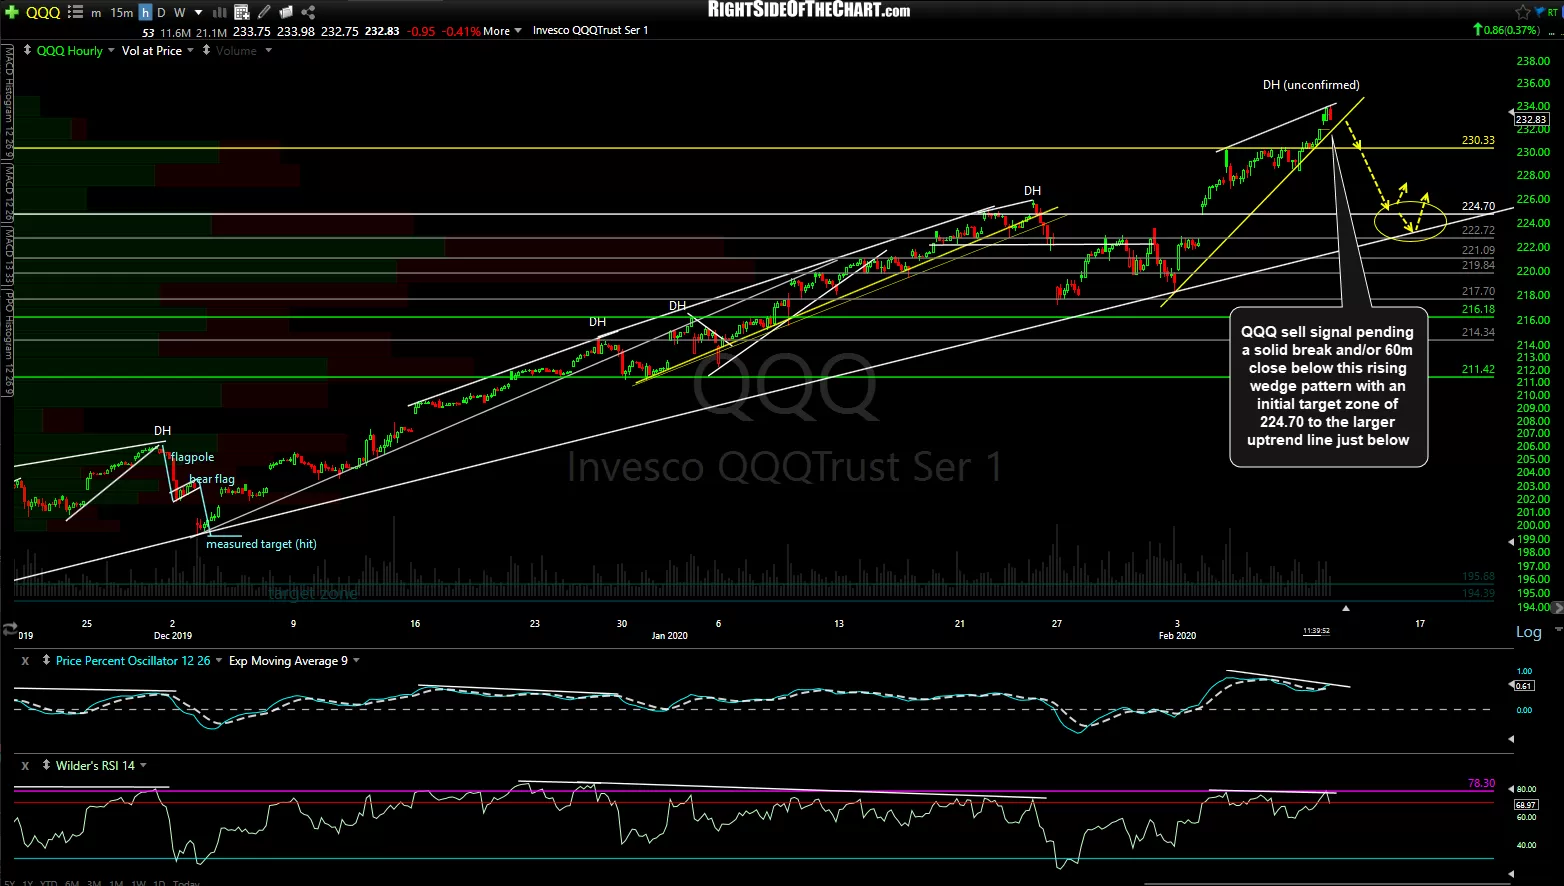
- QQQ 60m Oct 11th
-

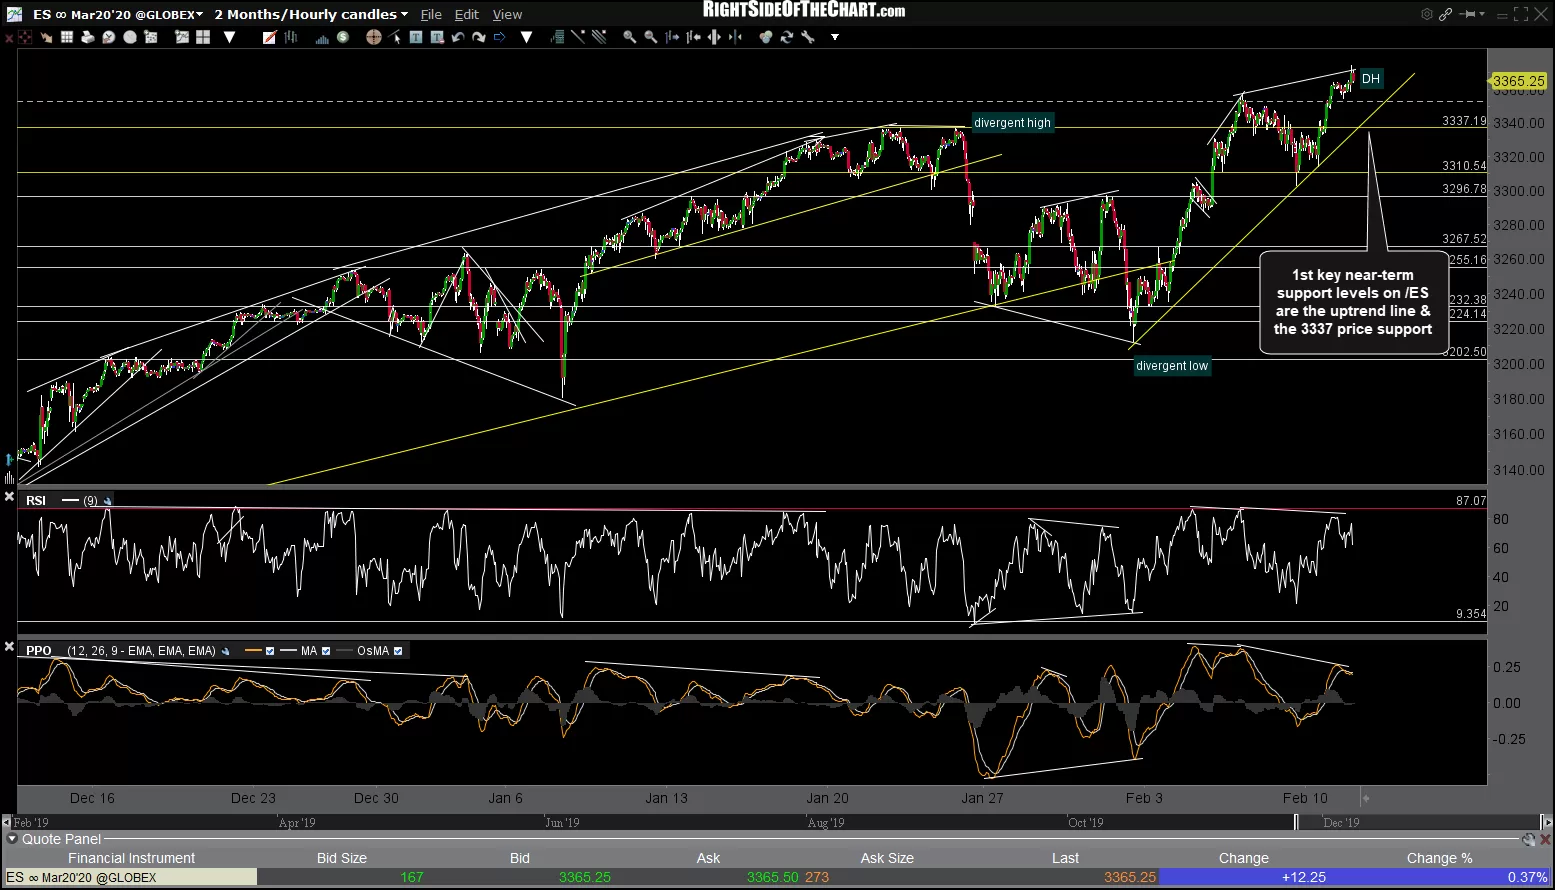
- ES 60m Feb 11th
-
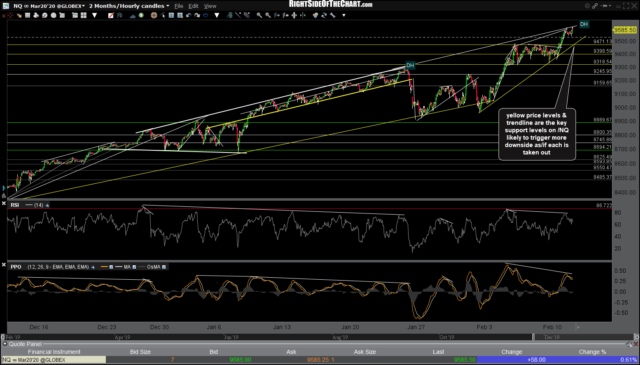
- NQ 60m Feb 11th
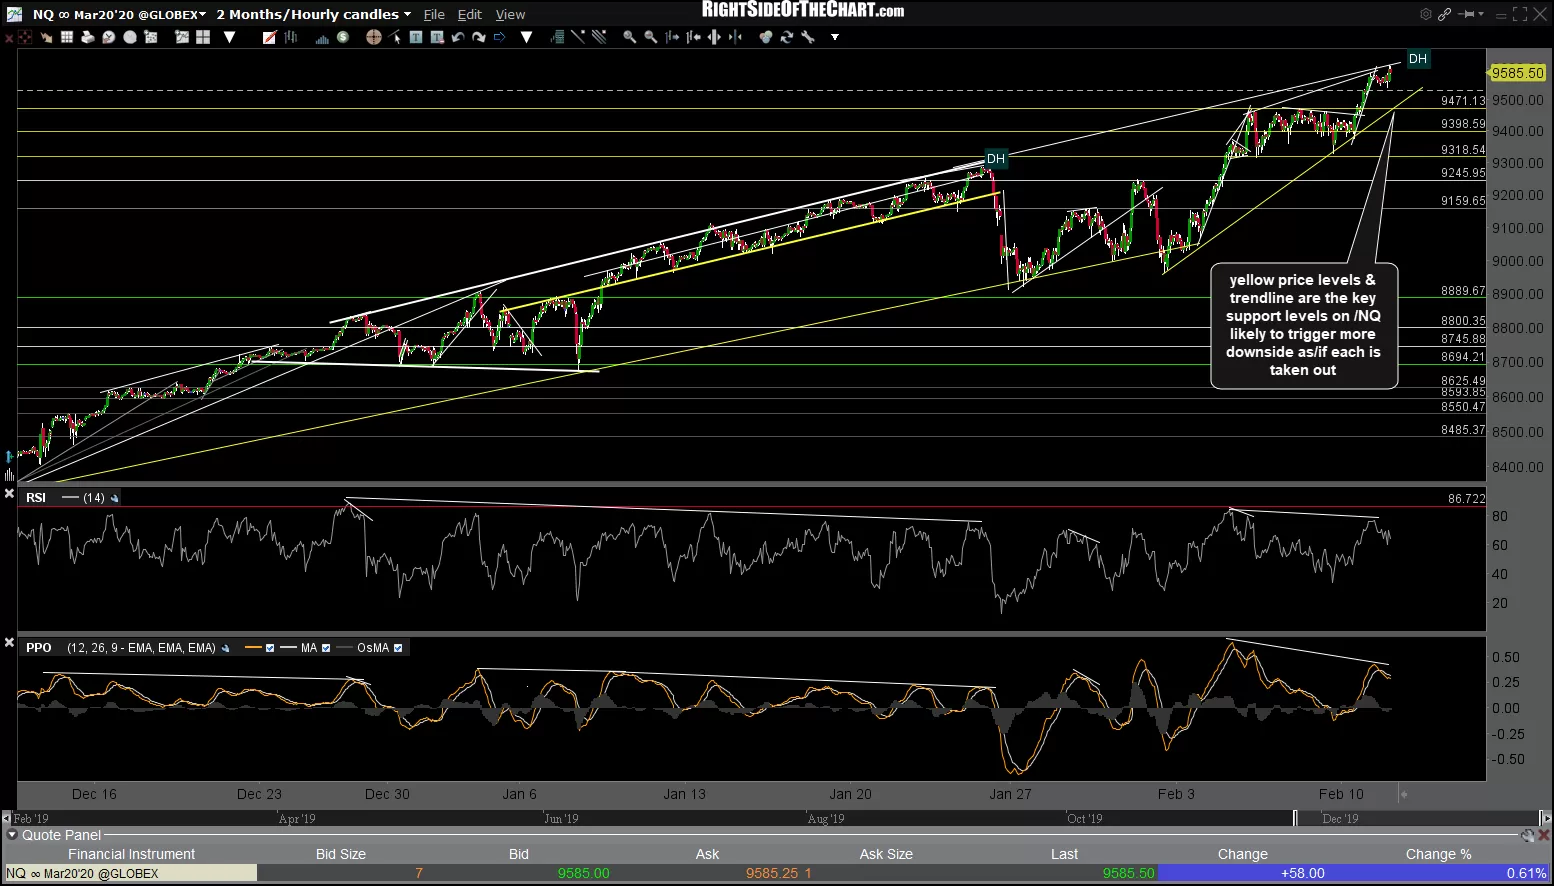
The current trend remains bullish for & when a stock or index is trading at or near all-time highs, there aren’t any resistance levels in which to target. As such, I like to share the salient support levels & potential price targets below for both those interested in shorting the next pullback as well as those looking to buy the dip by positioning long on pullbacks.
Also worth noting is the fact that I had highlighted the extreme overbought readings on the index futures 60-minute charts that occurred back on Feb 4th (/NQ) and Feb 5th (/ES), which are the red lines on the RSI. I had also pointed out in a video at that time, how most of those previous extreme overbought readings were followed by a marginal thrust higher in the indexes with the RSI going on to make a slightly lower overbought reading, i.e.- negative divergence, such as we have at this time.