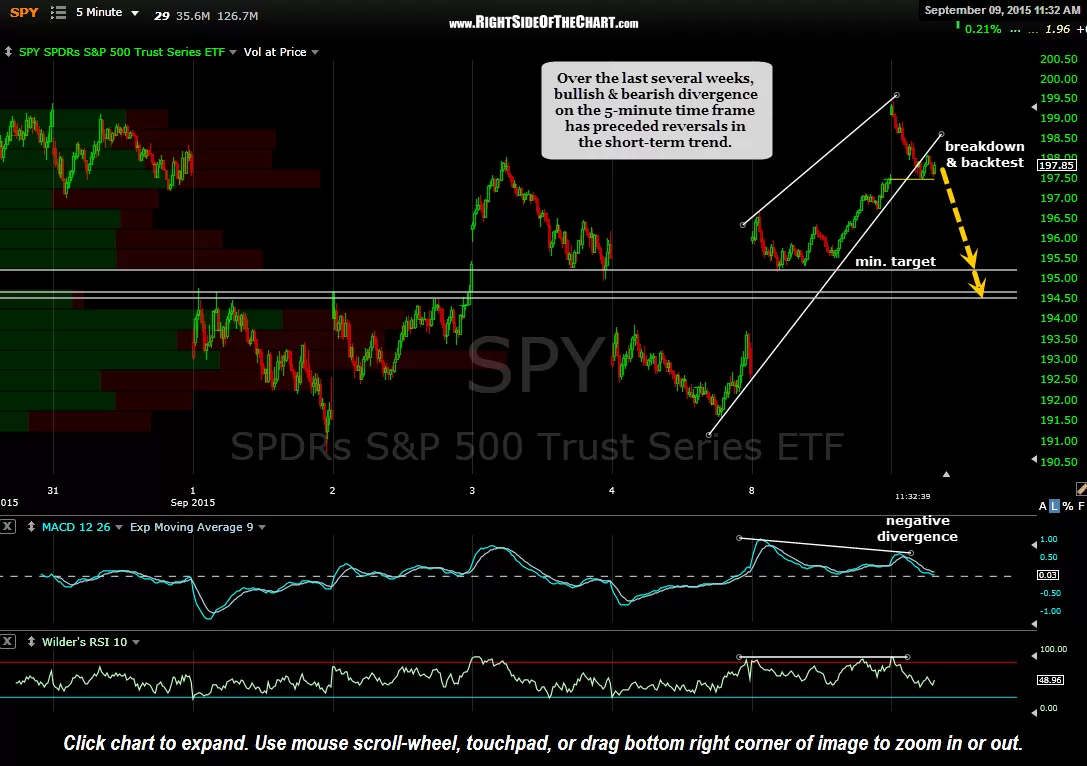
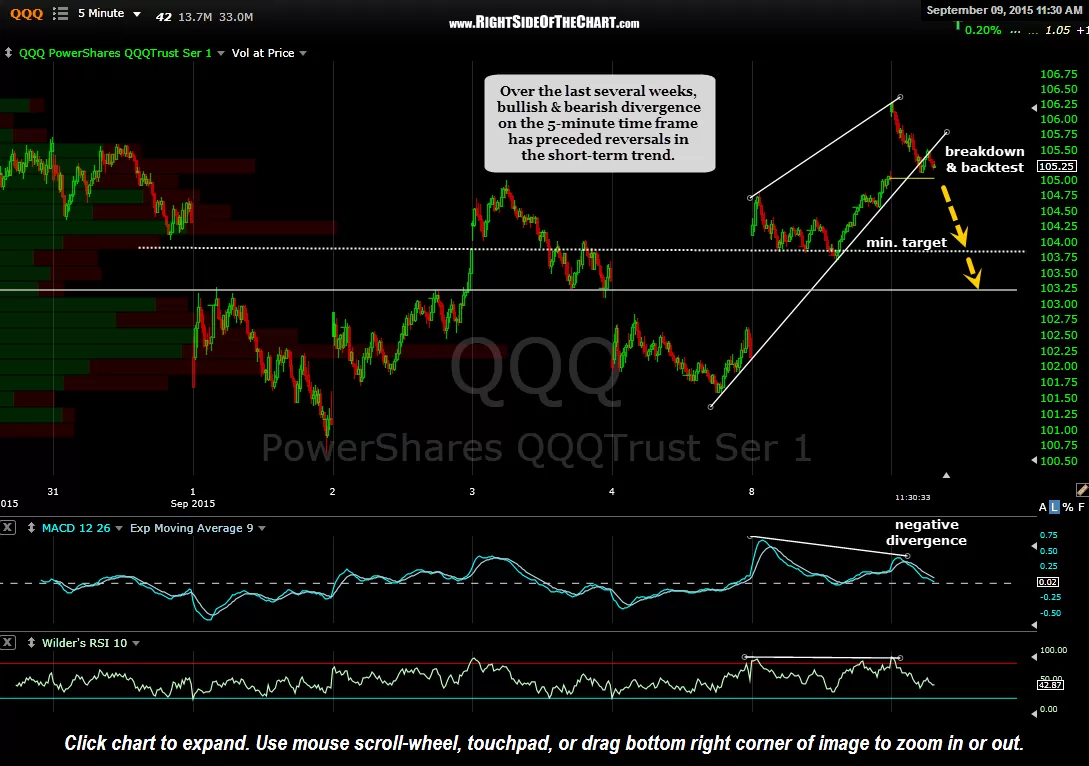
Over the last several weeks I’ve pointed out several (or all) of the divergent highs & lows on the 5-minute time frames of both the SPY & QQQ. In each instance, those bullish & bearish divergences have preceded reversals in the short-term trend, typically sparked by a trendline break. Although things could be different this time around, my minimum & preferred near-term pullback targets are shown below. It should be worth noting that assuming these short-term scenarios do play out, that would likely have longer-term bearish implications as a move down to these target levels would bring prices back within the recently highlight 60-minute triangle patterns, thereby signaling the recent breakouts have failed (i.e.- bull traps).
On the flip side, should these 5-minute bearish rising wedge patterns fail to play out, with prices moving higher to move back into the patterns & above this morning’s highs, that would have near-term bullish implications, indicating that there are more buyers than sellers in the market at this time. Personally, I haven’t reacted to either of the recent 60-minute triangle breaks (Friday’s downside break & yesterday’s upside break) nor this recent 5-minute rising wedge breakdown as I prefer to sit tight on my current holdings, waiting to see how the markets close out the week before making any meaningful changes to my positioning.
note: Yesterday’s CENX Long Trade Setup triggered the official entry earlier today. I tweeted out notification of the breakout earlier, along with an updated chart, which can viewed on the @RSOTC twitter feed on the left side of the home page. So far, CENX has traded sharply higher on above average volume since the breakout earlier today. Breakouts on above average volume have a much higher success rate than those on average or below average volume.
-
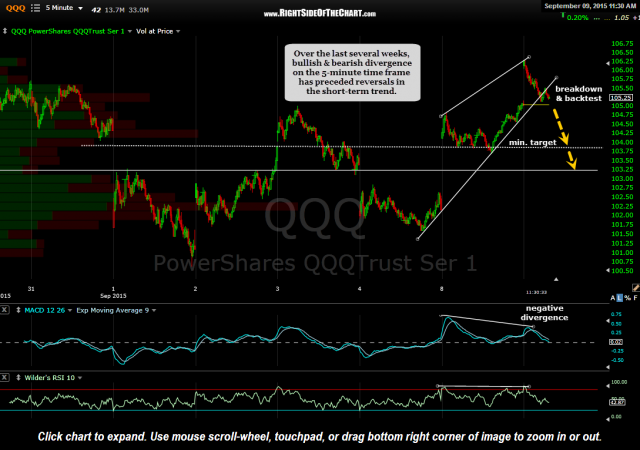
- QQQ 5 minute Sept 9th
-

- SPY 5 minute Sept 9th