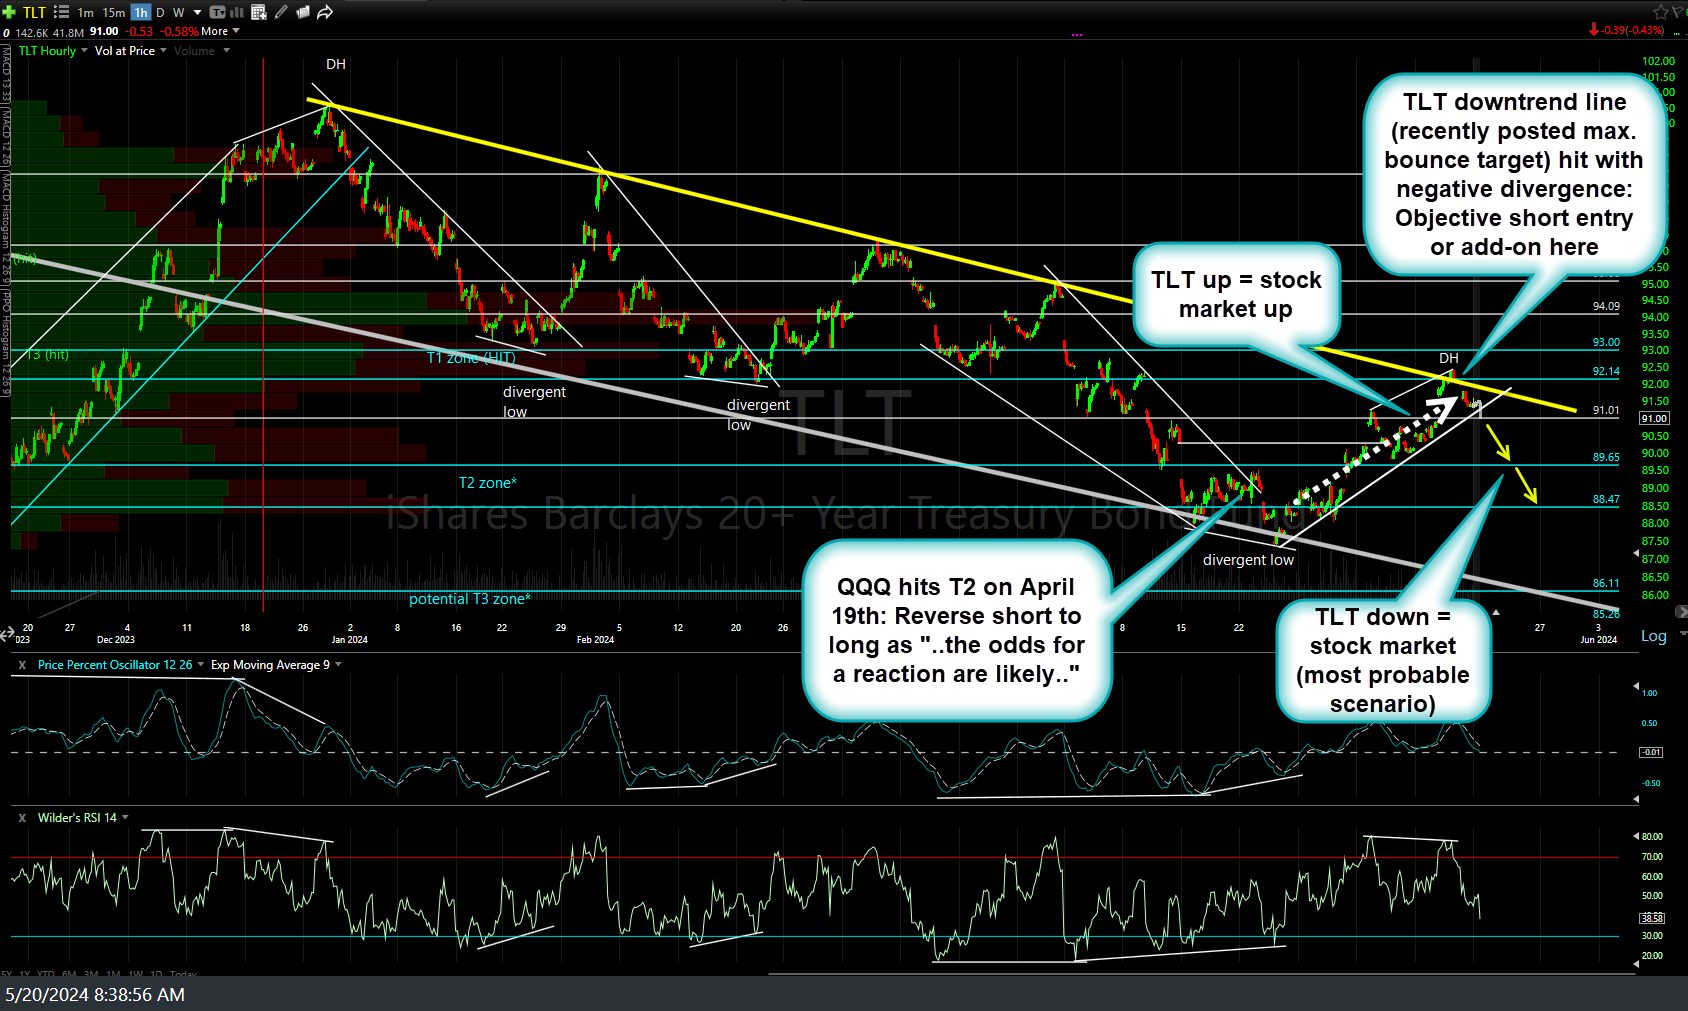
I plan to follow up with a least one video covering the stock & bond markets today but essentially, it continues to remain ALL about interest rates/inflation. TLT (20-30 yr Treasury bond ETF) has now hit the downtrend line which I was recently highlighting the week before I went on vacation & that max. bounce target (the yellow downtrend line) has now been hit, with negative divergences to boot, thereby offering an objective short entry or add-on here. 60-minute chart below.
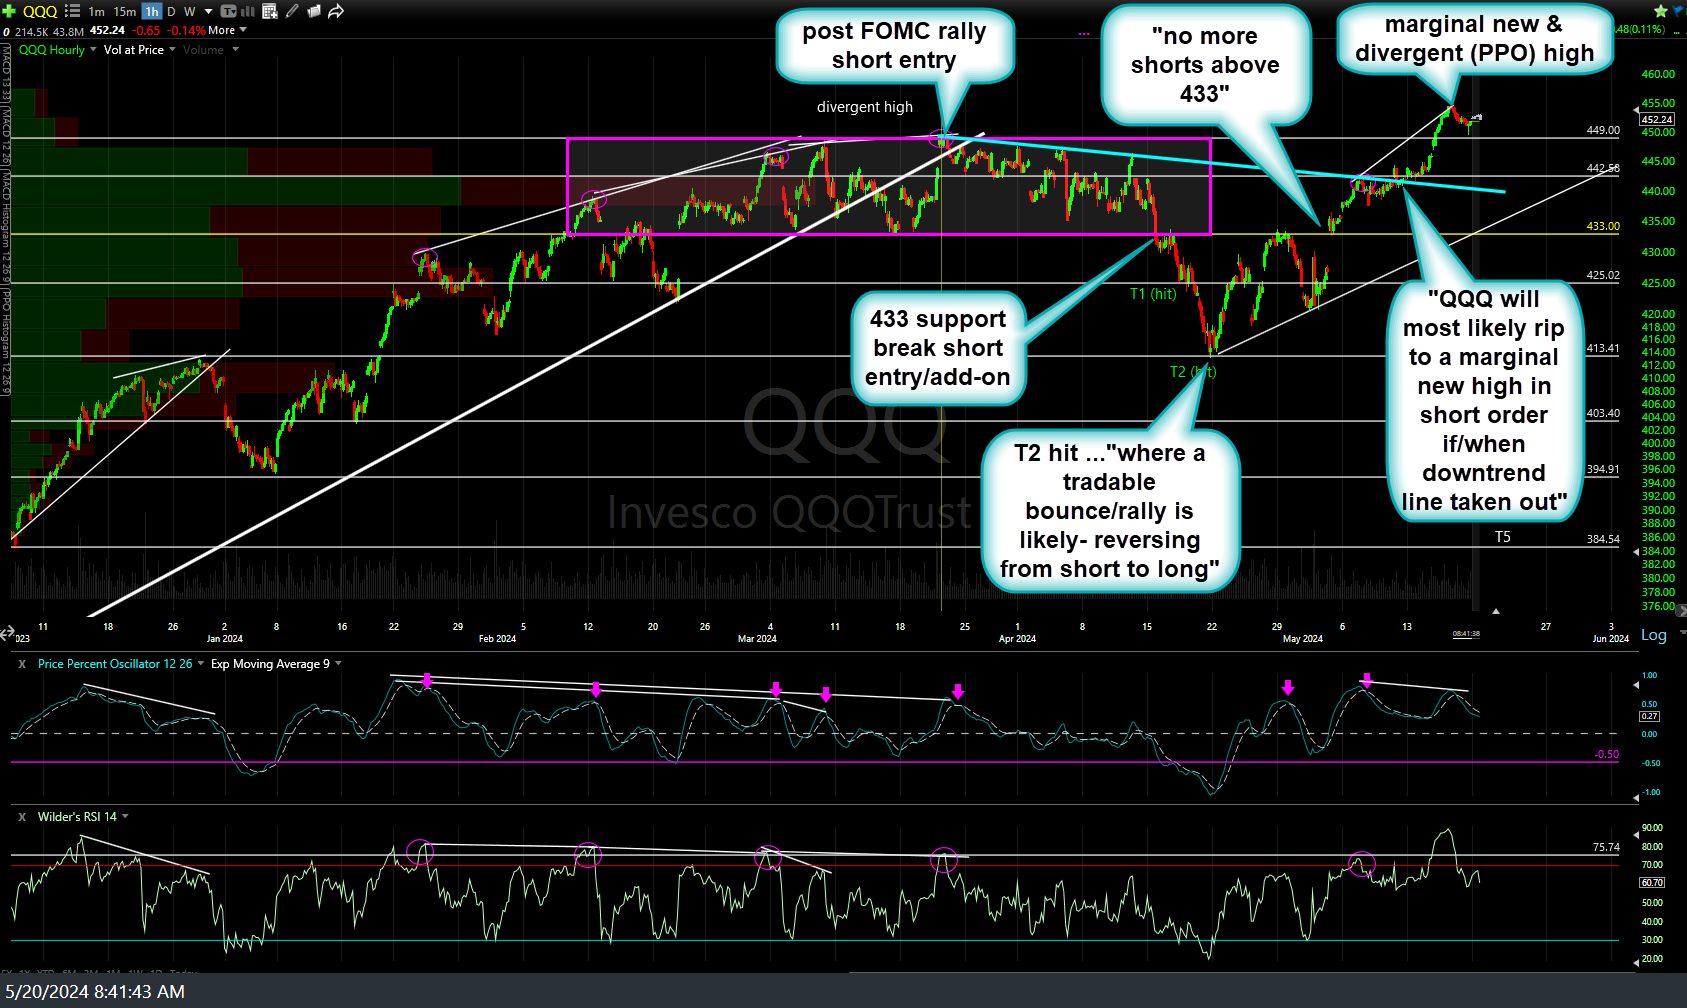
It’s pretty straight-forward: TLT up = rates down = stock market rallies; TLT down = stock market down. The last downtrend in TLT effectively bottomed around the same price level where QQQ bottomed & reversed off T2. As expected (stated in recent videos), QQQ would likely make a swift rip up to a new high if/when the downtrend line it has been testing was taken out (which it was when I was away last week) and that’s exactly what happened as soon as it did. QQQ 60-minute chart below.
So essentially, we have that marginal new & divergent (via the PPO) high with Treasury bonds at significant resistance (downtrend line) where a reaction (pullback) is likely. Of course, a solid & sustained breakout & rally above the downtrend line in TLT would be net bullish for the stock market, even if that comes after just a minor pullback or consolidation in Treasuries first.
Although we have some potentially market-moving economic releases on the calendar this week, the most significant report that will either make or break the stock market rally (and potentially continue the recent pattern of corrections following each marginal new & divergent high) will be the King Of All Things AI, NVDA, which reports earnings after the market close on Wednesday. I will cover NVDA along with the rest of the market-leading tech stocks in a video shortly along with some more precise price targets for a TLT or /ZB short trade (again, offering an objective entry here with stops somewhat above the downtrend line).


