Let’s take a look at the market using a top down approach starting with a long-term (40+ year) chart of the S&P 500, working our way down to the 60 minute time frame. This as monthly chart of the $SPX shows, prices have recently (commensurate to the scale of the chart) broken out to new highs, which on face value, is a bullish technical event.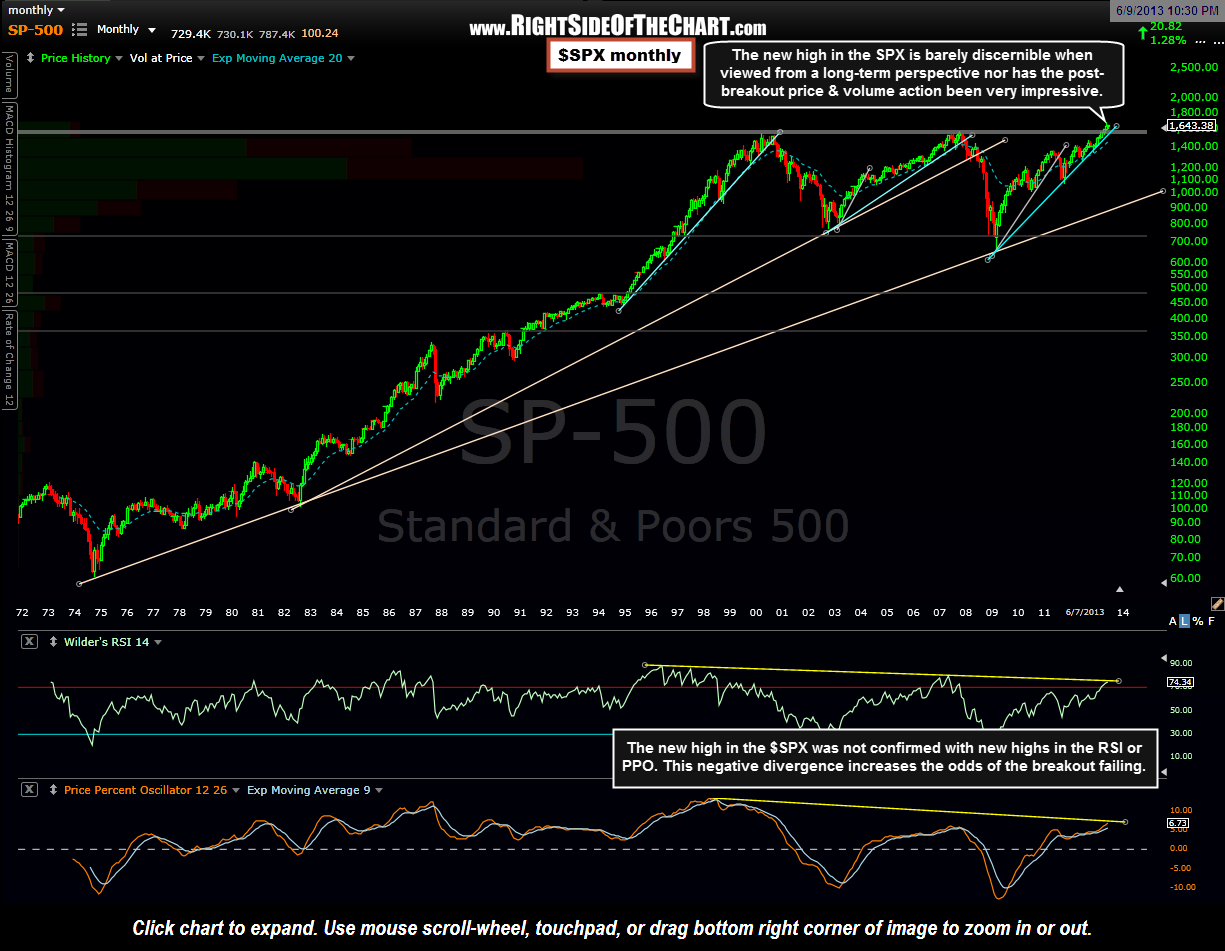 Although there is definitely an argument to be made as to why prices will continue to climb throughout the remainder of the year and possibly beyond, there are a some red flags that will most likely make the second half of the year a much more difficult slog for the market than the first half of 2013. To begin with, volume so far this year has been anemic. Typically, when a security or index makes a breakout to new highs, especially on such a well watched level such as this large, multi-year triple-top pattern on the $SPX, technicians look for a substantial increase in volume as a sign of confirmation. In the two months since the $SPX took out the previous high of 1576 set back in October 2007, volume has been less than impressive. Another sign of non-confirmation are the divergences on many of the key indicators and oscillators. In the monthly chart above, I use the standard RSI 14 along with the 12,26,9 PPO, which is works very similar to the MACD only the PPO is more useful over longer time frames, especially when the index or security has experienced significant price movements.
Moving on to the $SPX weekly chart, I have two variations of a rising wedge type pattern drawn on the index, the yellow trendlines and the white trendlines. We have prices overshooting not only both wedge variations but the previous high of 1576 set back in Oct 2007 as well. Therefore, any substantial drop below that level will confirm both a wedge overthrow (a technical event typically followed by a powerful reversal back into & below the pattern) as well as a failed breakout to new highs, i.e.- a bull-trap. As with the monthly time frame, the momentum indicators, price oscillators, and volume all continue to diverge from the value of the index on it’s recent breakout to new highs although any significant upside in the index from current level would likely bring the RSI & PPO to a higher high.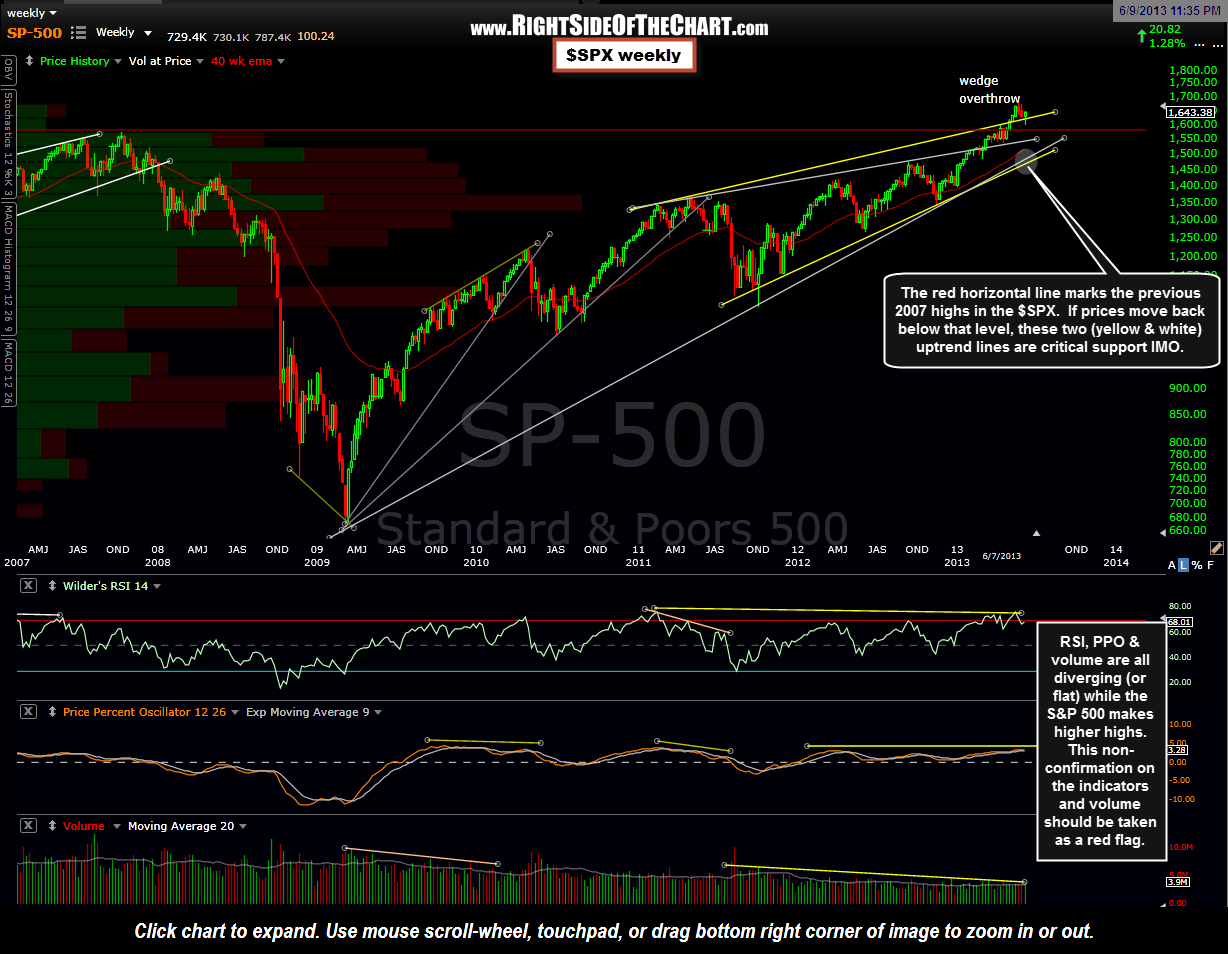 Moving down to the daily time frame, let’s take a look at the SPY. My focus here is on the current ascending channel (orange trendlines). Last week, prices fell to the bottom of the channel (my first price target) before bouncing on Thursday & Friday. This chart shows the targets shown on the previously posted 4 hour charts. At this time, I still favor my final target, T3 or roughly the 147.40 area, being hit. Although I don’t typically base my price targets on Fibonacci retracement levels, I do often add the fibs to my charts after I’ve identified my price targets and coincidentally (or not), they often do line up with one or more of the key retracemtent levels, such as T3 here which comes in right at the 61.8% retracement of the Nov 16, 2012 – May 22, 2013 uptrend. First things first though, as for that to happen, we’ll need to see prices break below the 160 area (support).
 Finally, zooming down to the 60 minute SPY chart, we can see that the bounce off the first target level (from the previous 4 hour charts) took us back up to close just above the downtrend line generated off the May 22nd highs. As we typically get a lot of end of week position squaring into a Friday close, I really wouldn’t read too much into a marginal close above resistance like that. How we follow through this week will be key. For those of us short, it would be nice to see prices to shoot back below this trendline at or shortly after the open tomorrow but we all know that Mr. Market never makes things easy for us. I wouldn’t be surprised to see some more of the whipsawing like we saw last week and although these intraday charts often play out very well for identifying levels where prices are likely to reverse, pretty much anything between the 159.80 support and the 169.07 highs is just noise. Although anything is possibly (i.e.- a fake-out or whipsaw), a break above or below those levels is likely to determine the next leg up or down in the market.
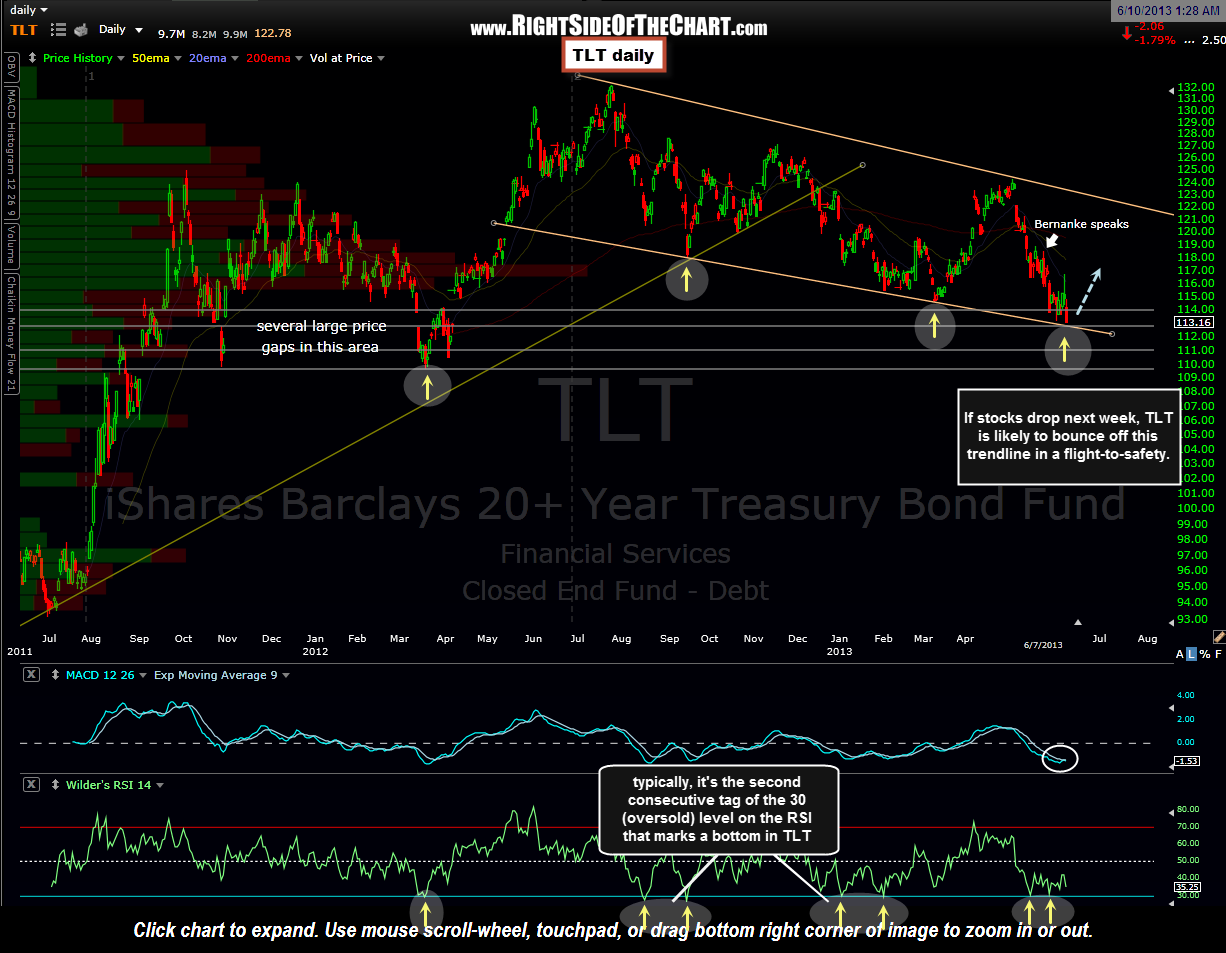
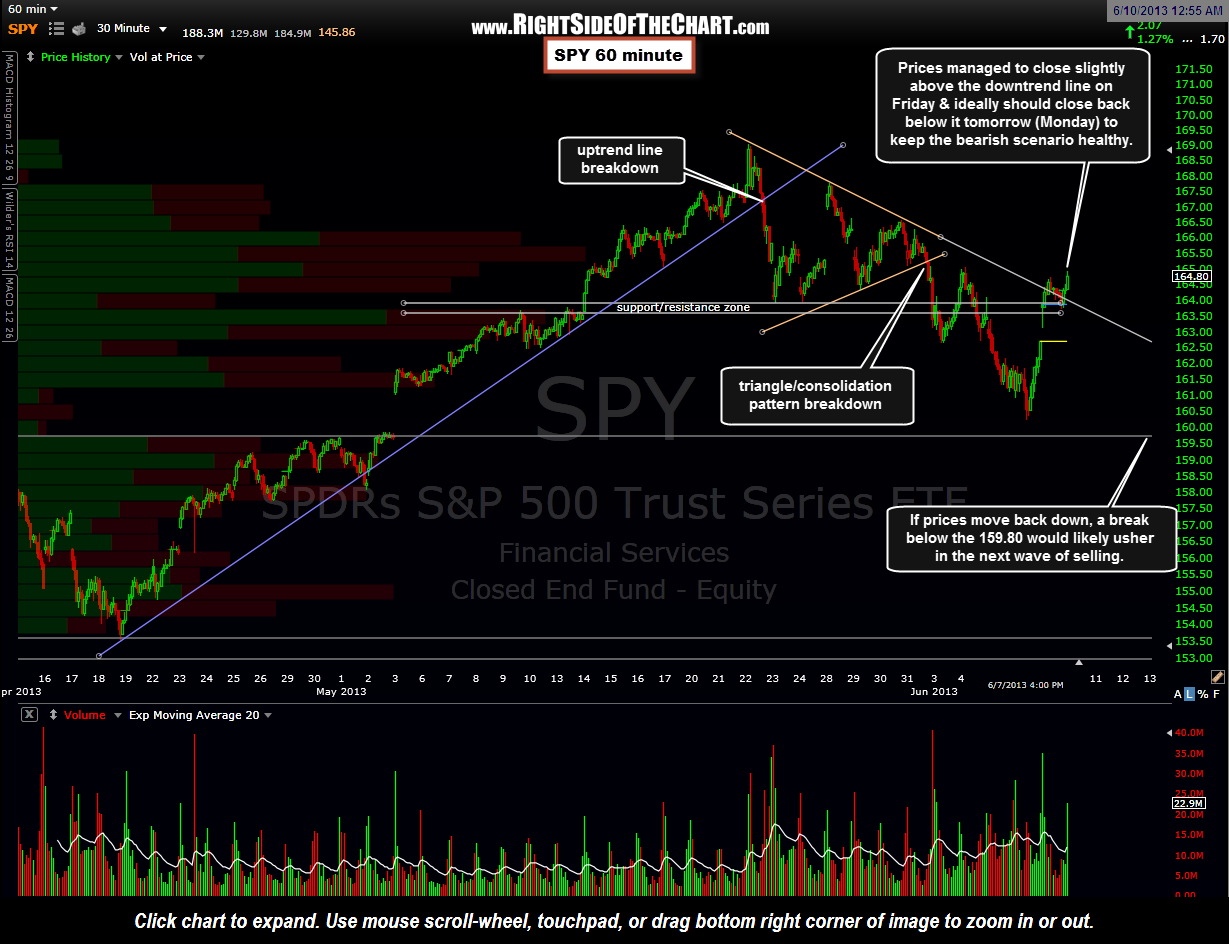 In wrapping this up, I just wanted to share my thoughts on the bond market, more specifically US Treasuries. In recent weeks I’ve been highlighting a rush for the exits in bonds and dividend stocks. In doing so I’ve made a case that barring any oversold bounces, we’ve likely begun what will prove to be a much larger trend reversal in bond prices (prices down, rates up). Although I still believe that to be the case, I do think that Treasuries are poised for a decent bounce (prices up/yields down). That belief is predicated on two factors: 1) The current technical posture of the charts and 2) My expectation of further downside in the equity markets. More than likely, if I’m wrong on one then I’ll be wrong on both. On the latter, if the market does drop another 10% from current levels (to my third target on the SPY), then we would most likely see a flight to safety with money moving into Treasuries (prices up/rates down). On the former, my expectation for a bounce is based largely off this TLT daily chart: