
Here’s a quick look at the bigger picture (long-term charts spanning decades using monthly candlesticks) followed by the short-term (60-minute) charts. The first chart below is a monthly chart of SPY going back to the early ’90s, encompassing the 3 official bull & bear markets over that time span. The previous bull market were all defined by prices moving above primary uptrend lines as well as the 20-month exponential moving average (20-EMA), with the bull markets ending once the broad market broke & closed below both the primary uptrend lines as well as the 20-month EMA followed by backtests of the 20-month EMA in every instance.
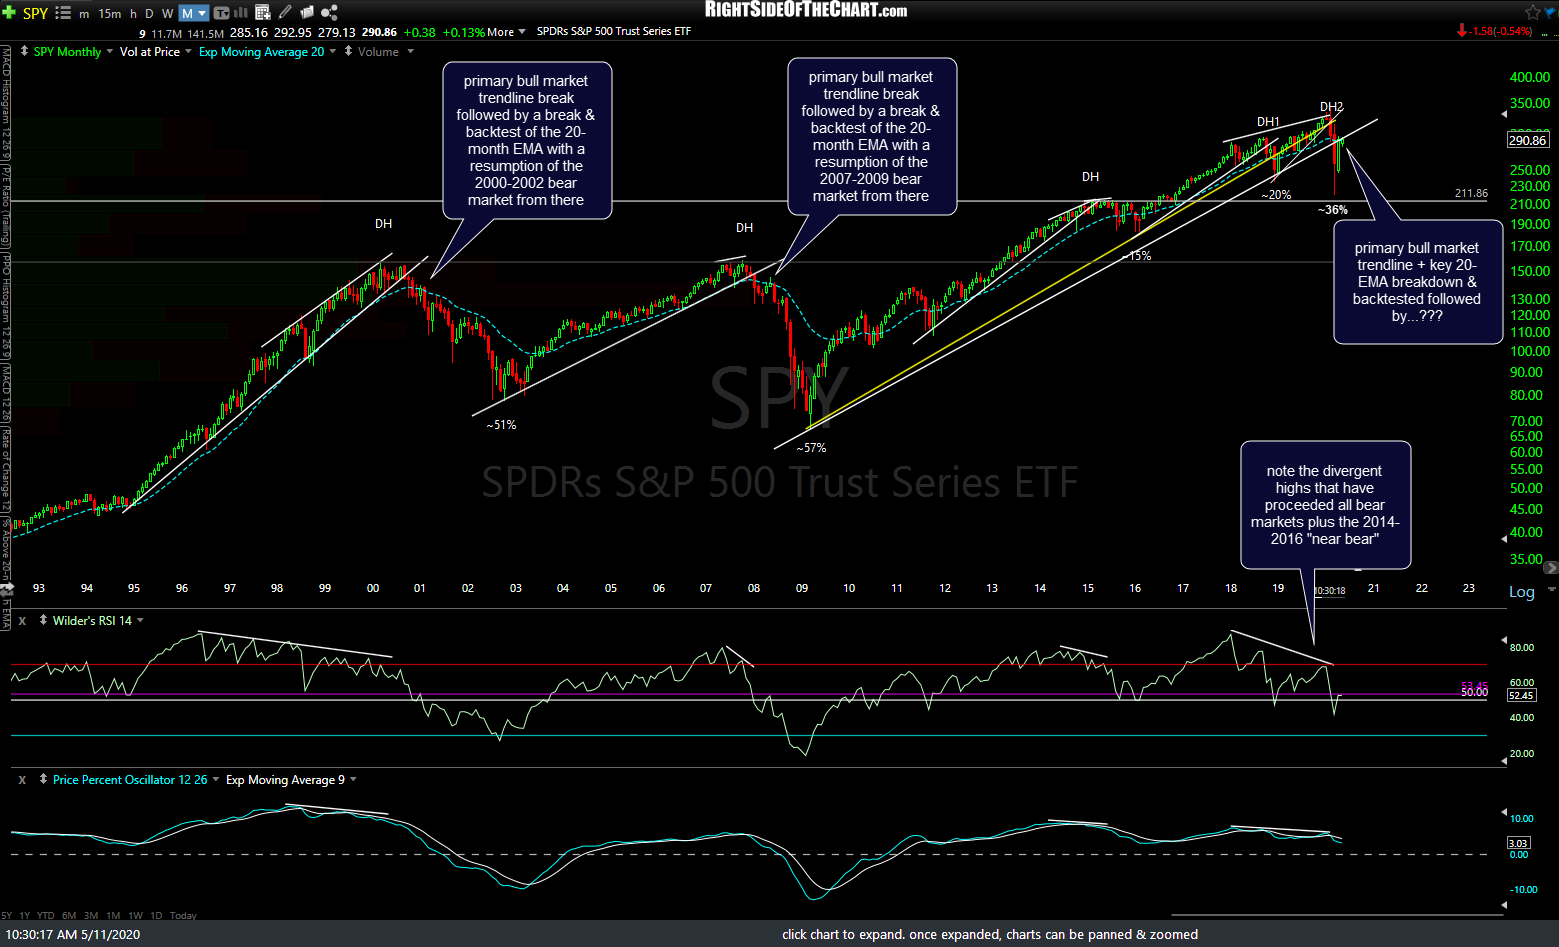
SPY monthly May 11th
In the previous two bear markets (2000-2002 & 2007-2009), the S&P 500 backtested the 20-month EMA on the initial bear market rally that followed the first major leg down after the previous bull market ended. This time around, SPY is currently backtesting the 20-month EMA as well as the primary uptrend line from below following the previous backtest & failure to regain either of those former support, now resistance levels last month. Will history repeat? Only time will tell but as of now, by nearly all metrics, a solid case can still be made that the rally off the March lows is just the initial bear market rally with a larger bear market with plenty more downside to come. Of course, one could also make a case that the market will soon go on to take out those resistance levels & power on to new highs & beyond but either way, it is hard to argue that the stock market does not have a confluence of very significant resistance levels to contend with just overhead.
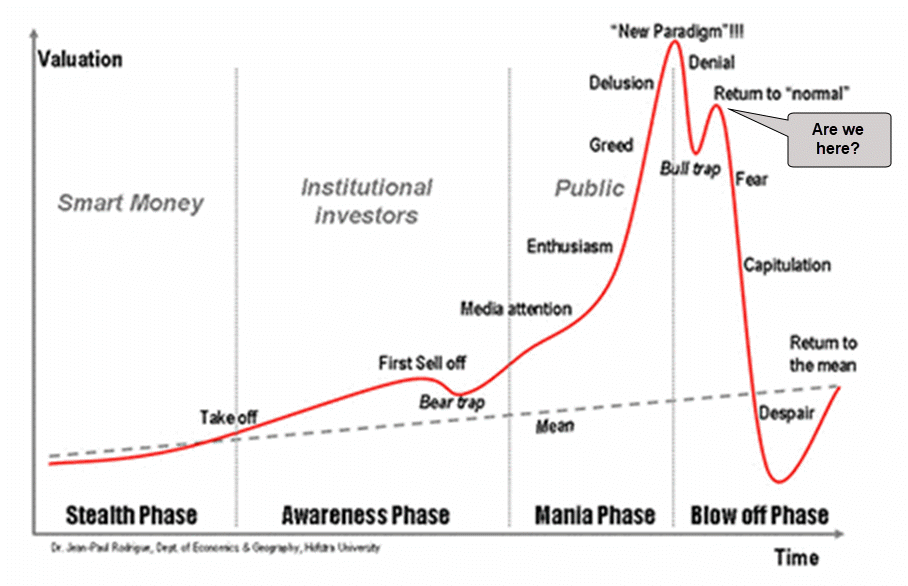
stages of a bear market 5-11-20
While not as diversified as the S&P 500 (which contains 500 large-cap US companies across multiple sectors), the 30-stock Dow Jones Industrial Average is still one of the better proxies for the overall stock market. DIA (DJIA tracking ETF), shows a similar pattern of signaling the start of a new bear market once both the primary bull market uptrend line, as well as the 20-month EMA, is taken out on a monthly closing basis, with the initial bear market rally backtesting the 20-month EMA from below & falling between the key 50% & 61.8% Fibonacci retracement levels before the 3rd & most powerful wave in the bear market. Having lagged somewhat behind SPY during the recent rally, or more so falling more on the initial leg down into the March lows (hence, more ground to regain), DIA could still rally about 4-5% off last week’s highs or 6% from current levels before the initial backtest of the 20-EMA & bull market trendline as well as the comparable retracement of that initial leg down back in 2008.
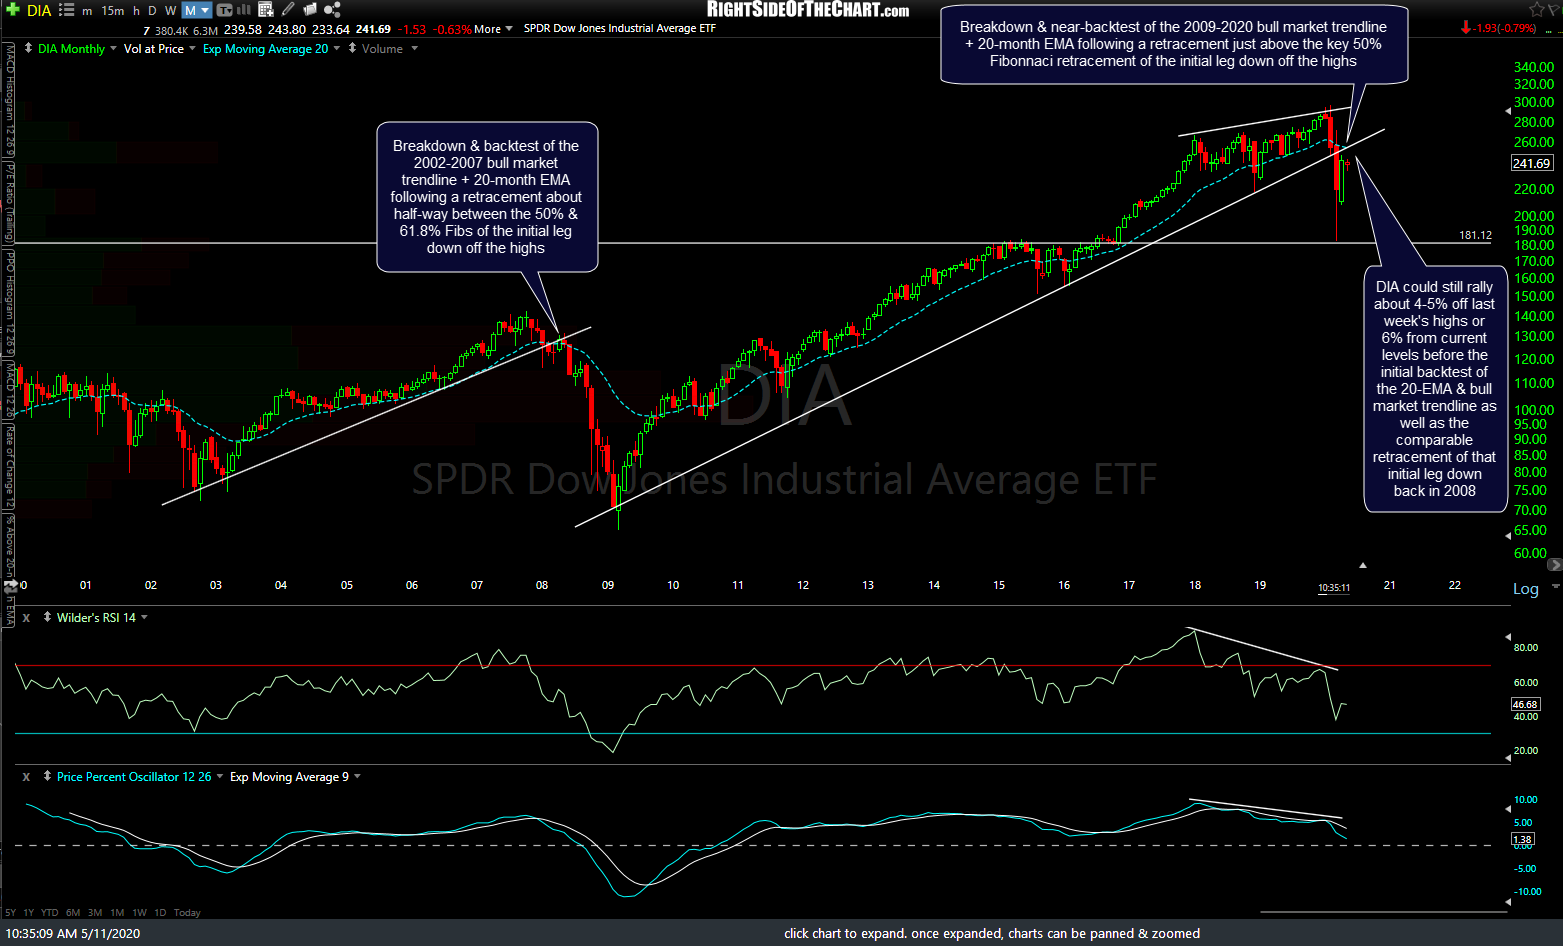
DIA monthly May 11th
Zooming down to the intraday (60-minute) chart, SPY has been stalling out at longer-term resistance levels on the daily, weekly, & monthly charts with negative divergences continuing to build on this 60-minute chart & the next sell signal to come on a break below this small wedge pattern while any marginal new high soon would extend the existing divergences.
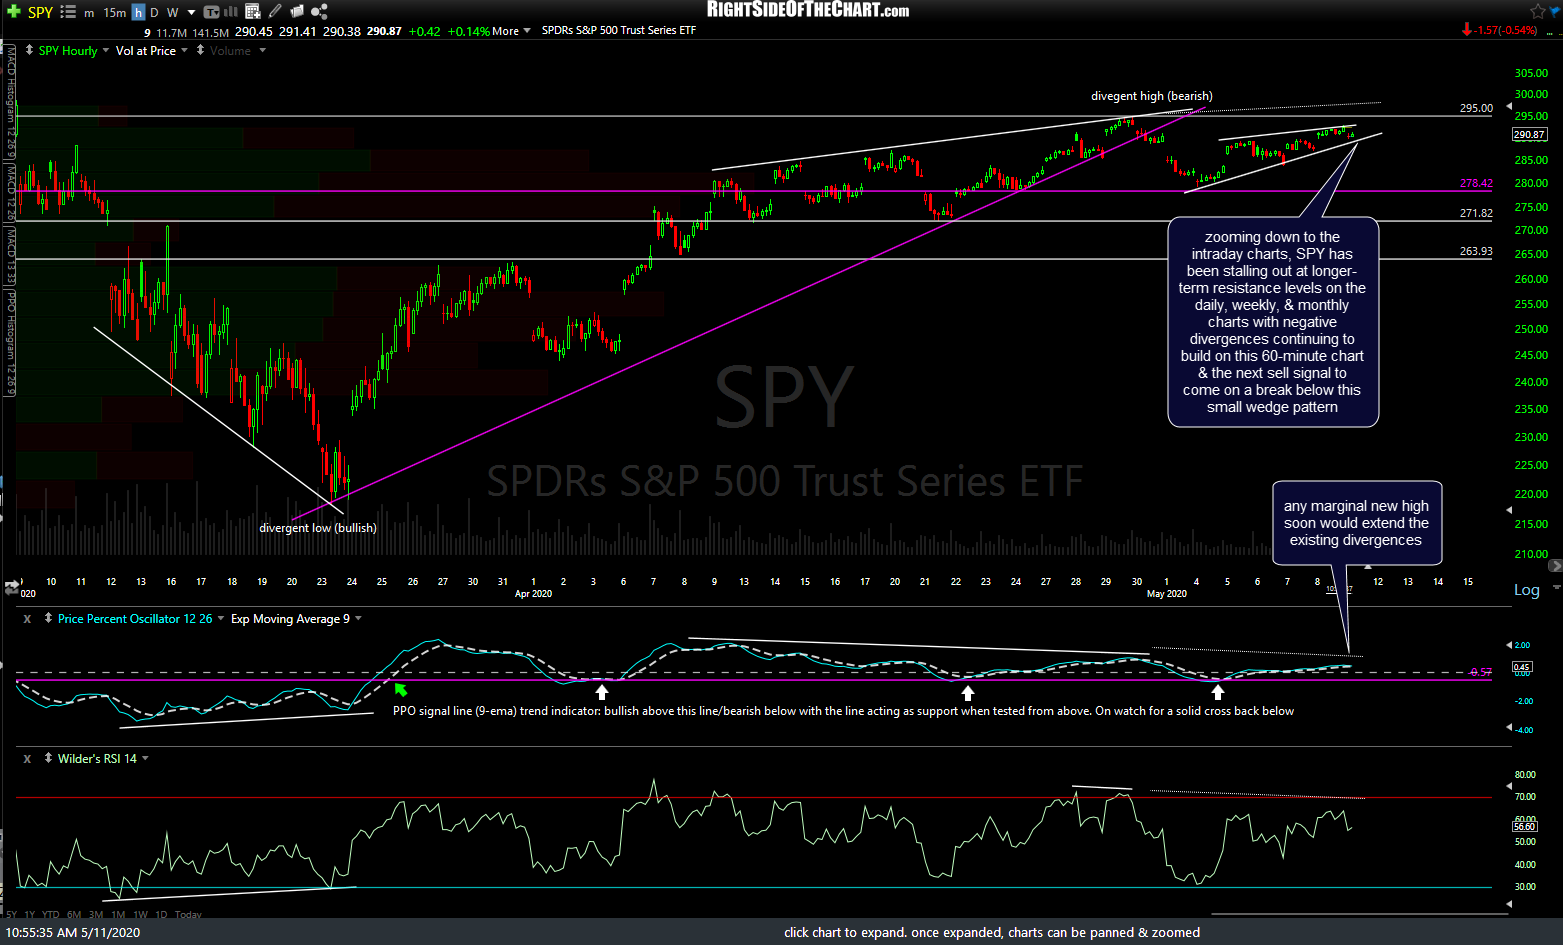
SPY 60m May 11th
Bottom line: The near-term trend remains bullish to sideways as the stock market has rallied back to or just below multiple long-term resistance levels which it has been testing from below for the past several weeks. While the magnitude of the drop off the previous bull market top in mid-February into the March lows, as well as the subsequent rally since have been larger than the first two primary waves in previous bear markets, they are nearly identical in proportional terms and also commensurate to the scope & magnitude of the preceding bull market (one of the longest & strongest in history).
One thing to consider when factoring in long-term (weekly & monthly) charts into your analysis is that even if the technicals play out as the charts indicate (i.e.- a major trend reversal, rally, correction, etc..) it can take quite a bit of time for the technicals to play out. Key support & resistance levels can be & often are tested for many weeks or even several months before a reversal & sustained trend off those levels or a breakout above/below those levels followed by the next major trend.
While only time will tell which direction the next 10-20%+ in the market will be from here, largely based on the technical analysis in the monthly charts above as well as the overwhelmingly bearish fundamental/macro trend in the US & global economies, it still appears to me that the R/R on the US stock market is skewed to the downside at this time, regardless of the near-term trend.
Keep in mind that forecasting where the stock market is headed at any point doesn’t necessarily have a binary outcome (i.e.- the stock market must either go up or down, as sideways is another possibility). If you glance the candles on that monthly chart of SPY at the top of this post, you will see that in previous bear markets, once the stock market closed below the 20-month EMA, it tested (i.e.- traded in a relatively large, sideways range) for an additional 3-4 months. As of now, SPY is only 11 days into the second monthly candlestick backtest of the 20-ema. As such, one needs to define their trading style (e.g.- active trader, day trader, swing trader, investor) in order to decide whether to give a higher weighting to the longer-term charts or the shorter-term charts with their trades.