
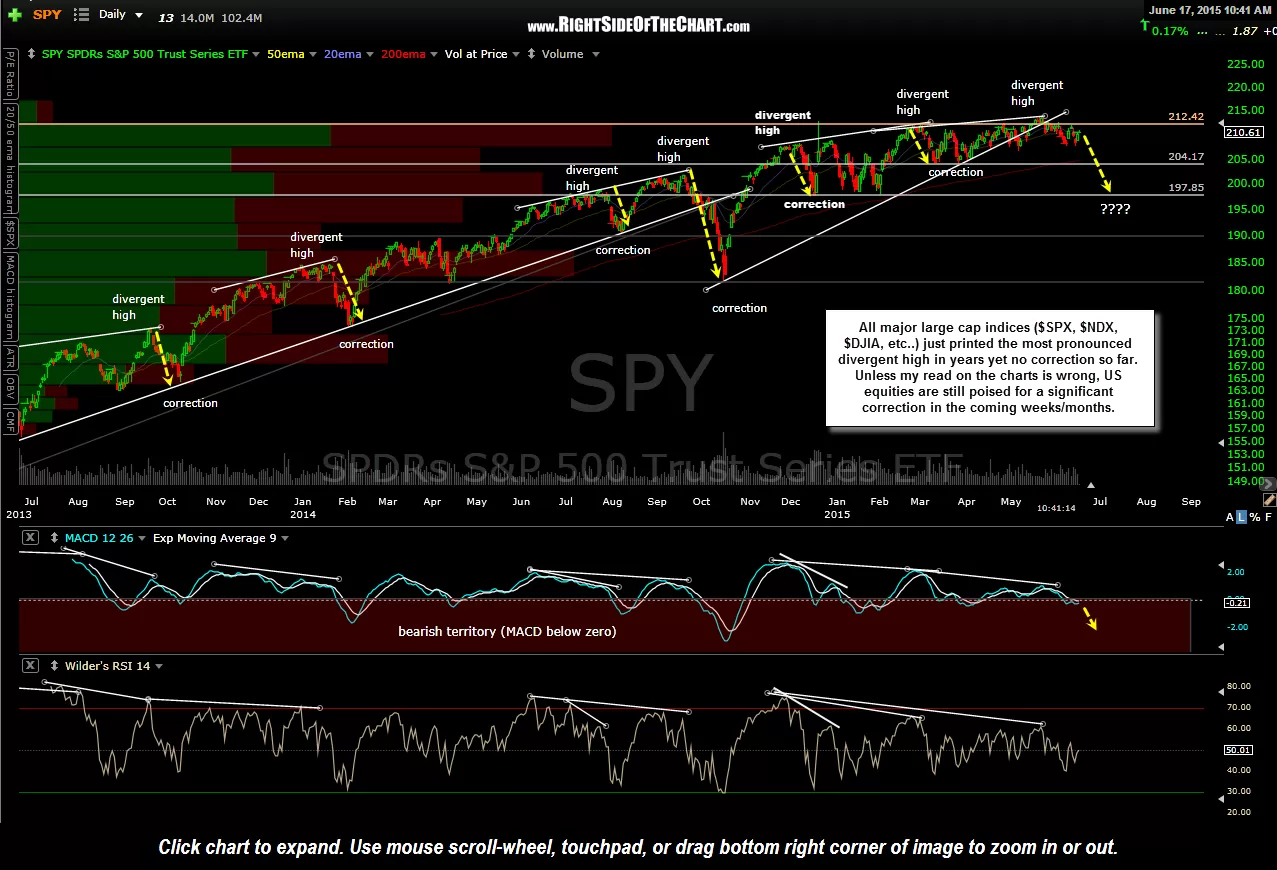
Market commentary & trade updates continue to be light as I haven’t noticed any new technical developments worth mentioning. All major large cap indices ($SPX, $NDX, $DJIA, etc..) just printed the most pronounced divergent high in years yet no correction… so far. Unless my read on the charts is wrong, US equities are still poised for a significant correction in the coming weeks/months. Not only has the stock market gone virtually nowhere for weeks now, chopping around in a relatively narrow, difficult to trade range, the market (S&P 500) has essentially gone nowhere all year, up a whopping 1.9% from where it closed out 2014 and where already well into the second half of 2015.
-

- SPY daily June 17th
-
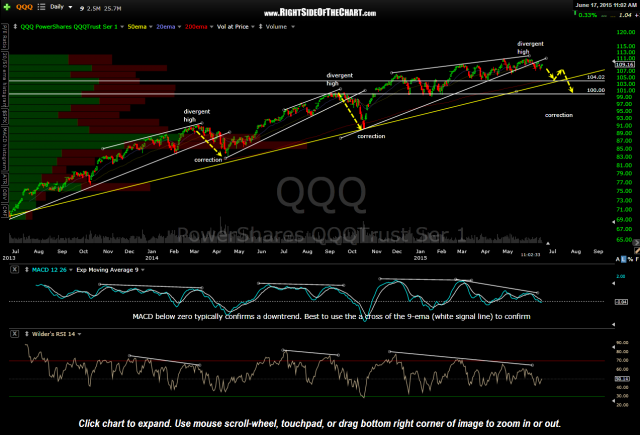
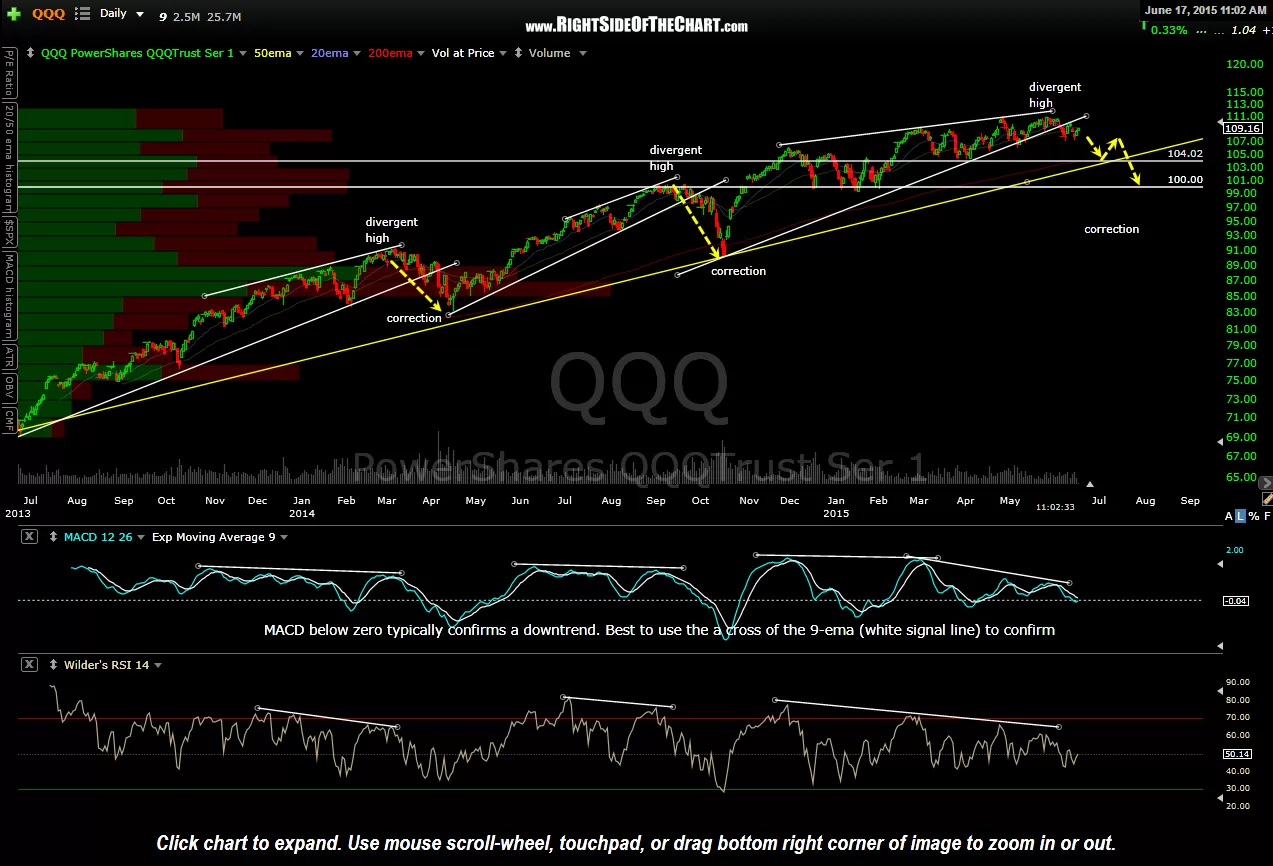
- QQQ daily June 17th
I’ve also highlighted in recent months how plunges in volume often precede corrections and once again, all major US indices and their respective tracking etfs have recently hit the “red zone”, as shown in the QQQ chart below. Another point worth mentioning is the recent contraction in the Bollinger Bands as a result of the relatively flat trading range over the past several months. Such contractions or “pinches” in the Bollinger Bands often precede sharp moves in stock prices, up or down, but based on the current technical posture of the US markets, my money is on a downside resolution of the recent trading range. At this point in time, I’m waiting for a break below the June 9th lows in both the SPY & QQQ for the next sell signal before adding any more short exposure to the broad market.
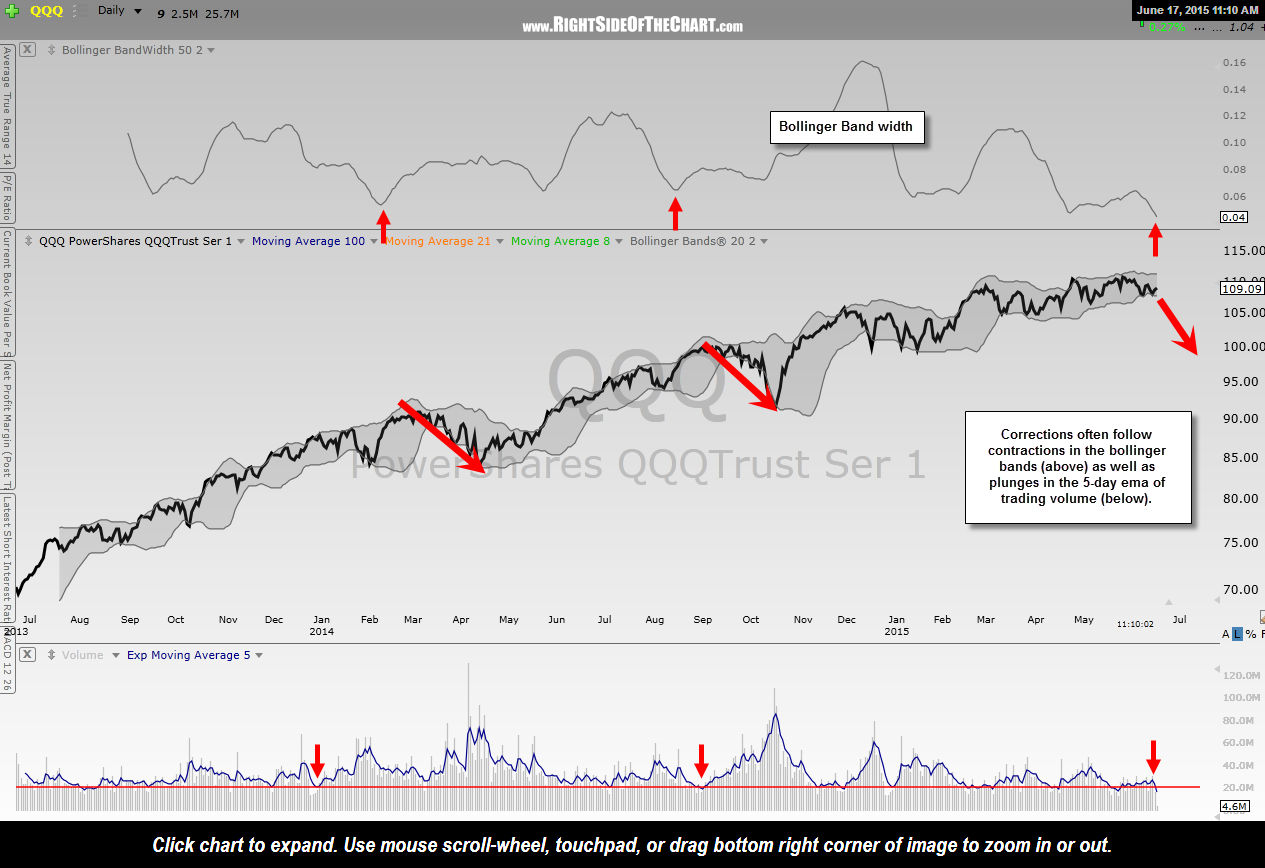
QQQ Bollinger Bands Pinching