
The following charts are a compilation of various breadth indicators used to gauge the health (or lack thereof) of an advance in the stock market. This first chart plots the Nasdaq Composite (bottom) against the $NAAD, Nasdaq Advance/Decline line (top), which shows the number of stocks in the Nasdaq Composite advancing minus those that are declining. During a healthy advance, the $NAAD is rising along with the index & as this 16-year chart below shows, all major corrections & bear markets were preceded by divergences between the $NAAD & $COMPQ.
While divergences along are not a sell signal, as they can & often do continue to build for extended periods of time, they are a warning sign that an impending trend change is likely. As this chart highlights, this is the first time that we’ve had substantial divergences between $NAAD & $COMPQ since those leading up to the 2015 major correction/near-bear market.
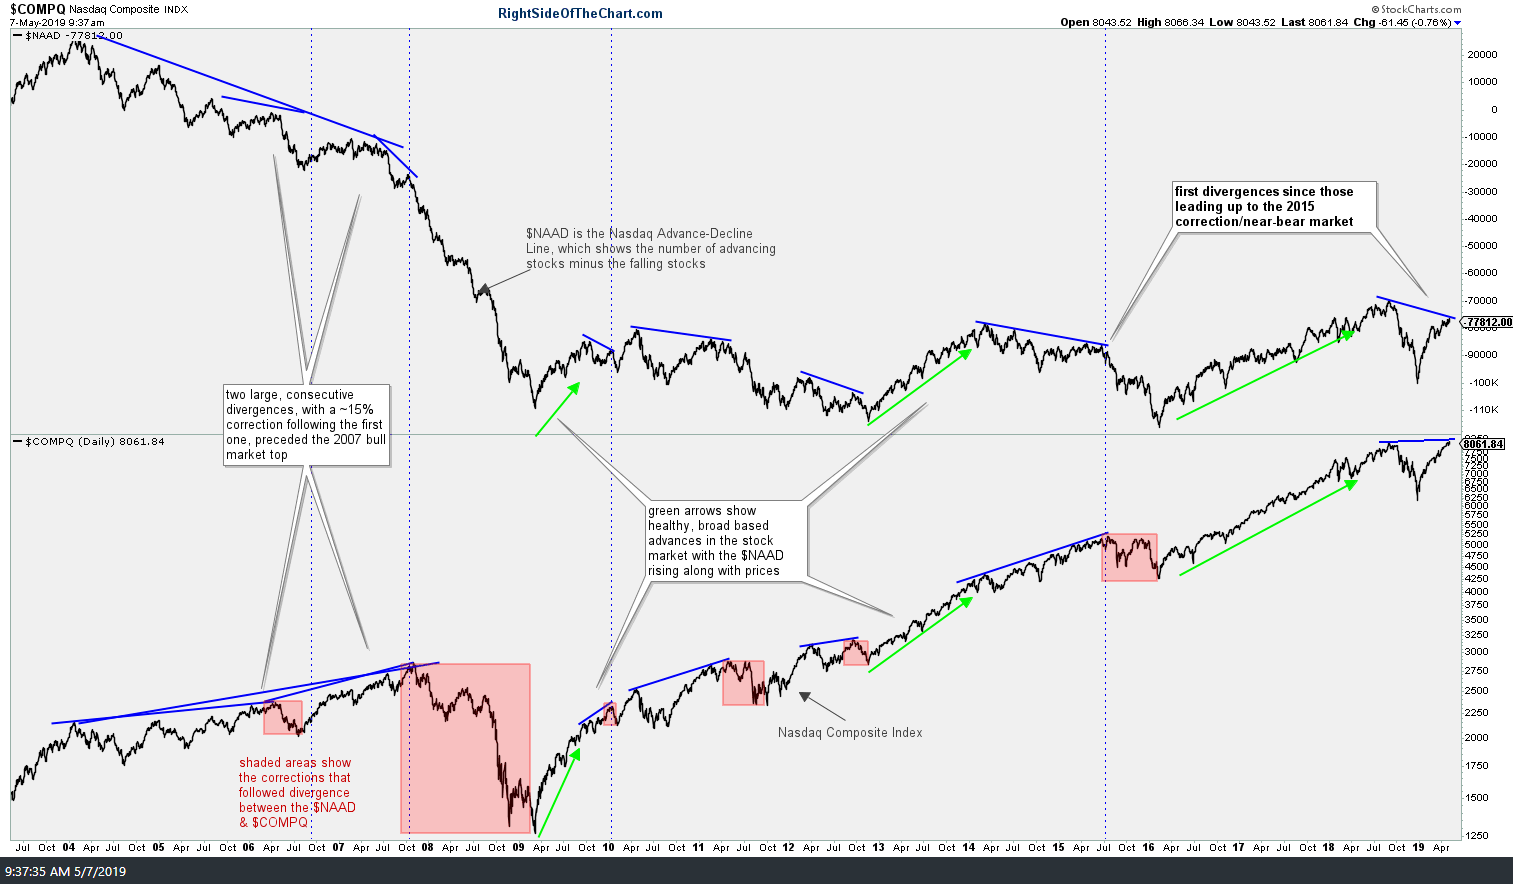
COMPQ vs NAAD May 7th
*all charts will expand if clicked on. once expanded, the charts can be panned & zoomed*
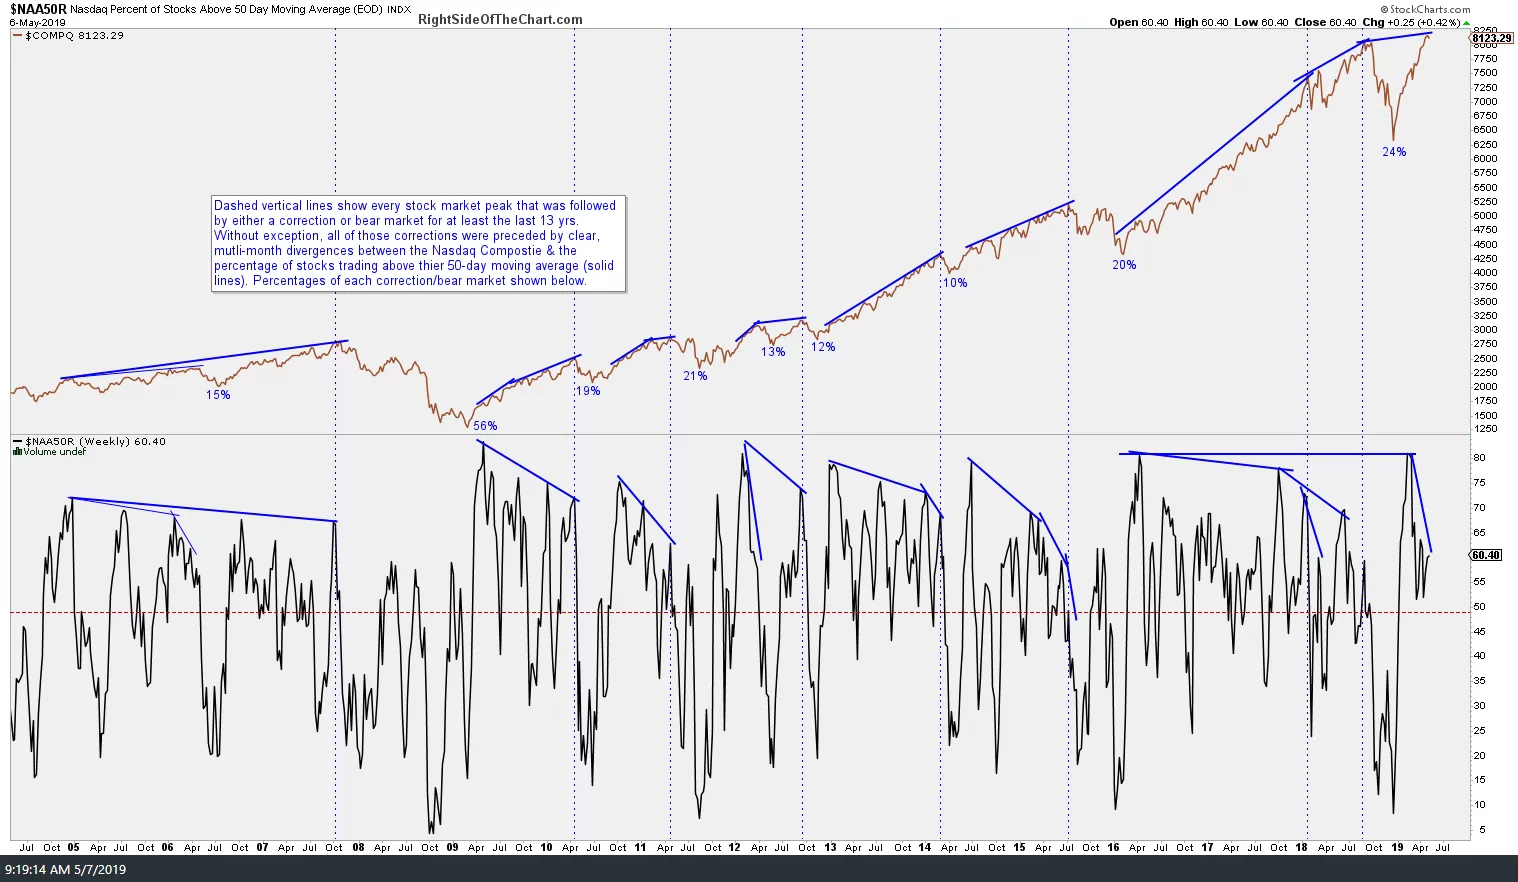
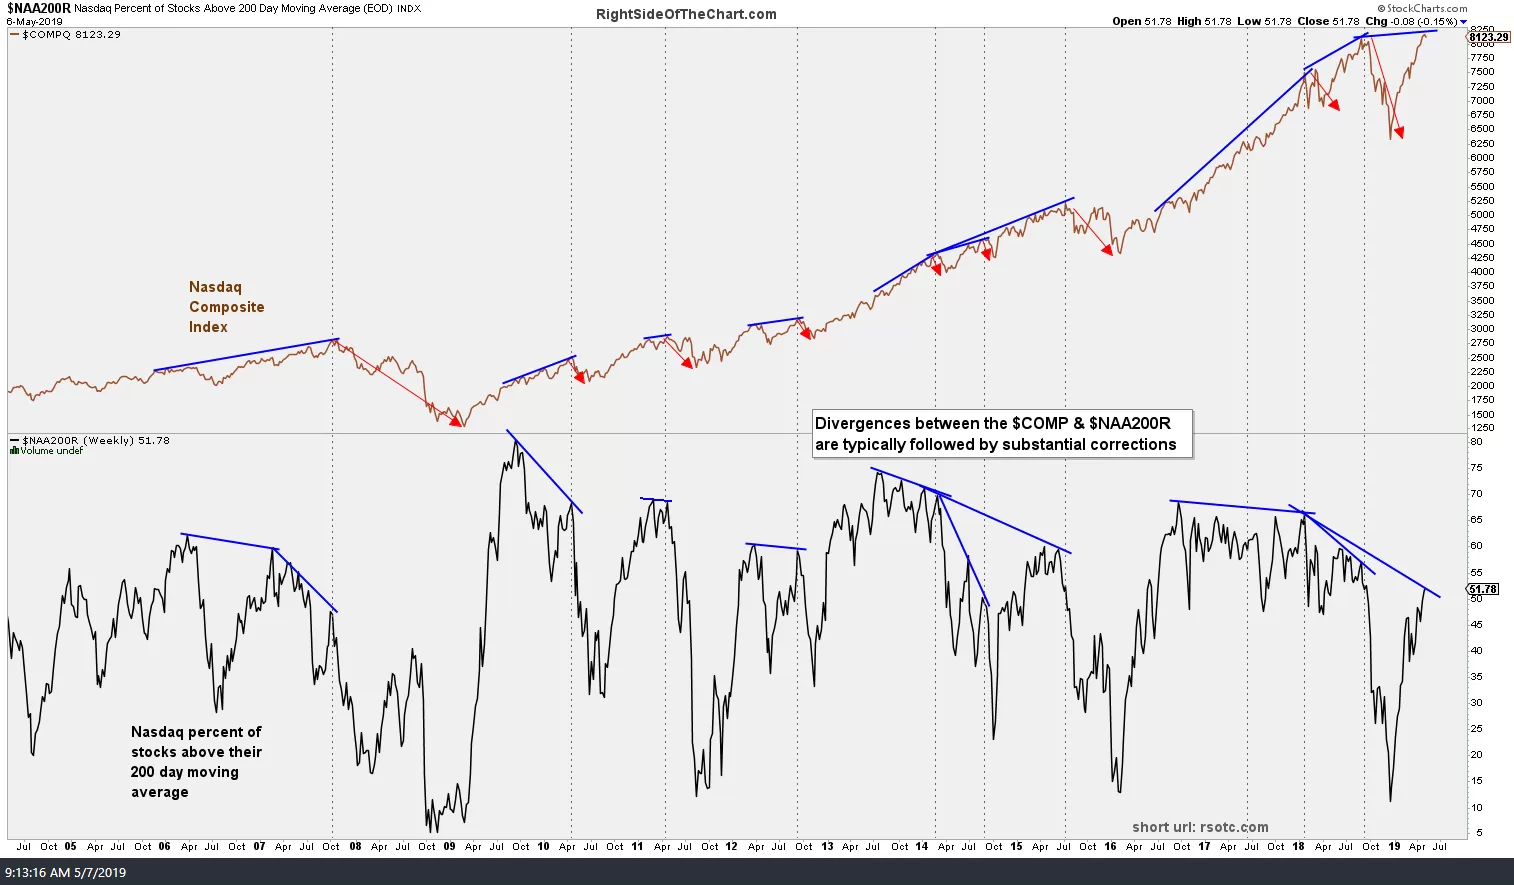
The next two charts below plot the Nasdaq Composite ($COMPQ) against the Percentage of stocks in the Nasdaq trading above their 50-day & 200-day moving averages. As with the $NAAD above, divergences between the $COMPQ and the $NAA50R & $NAA200R are typically followed by corrections and/or bear markets.
-

- NAA50R May 7th
-
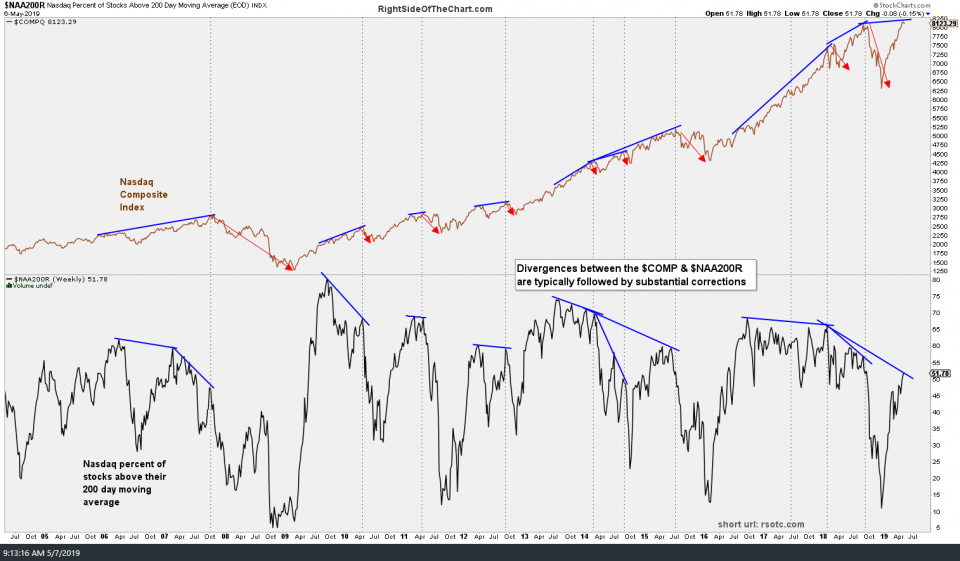
- NAA200R May 7th
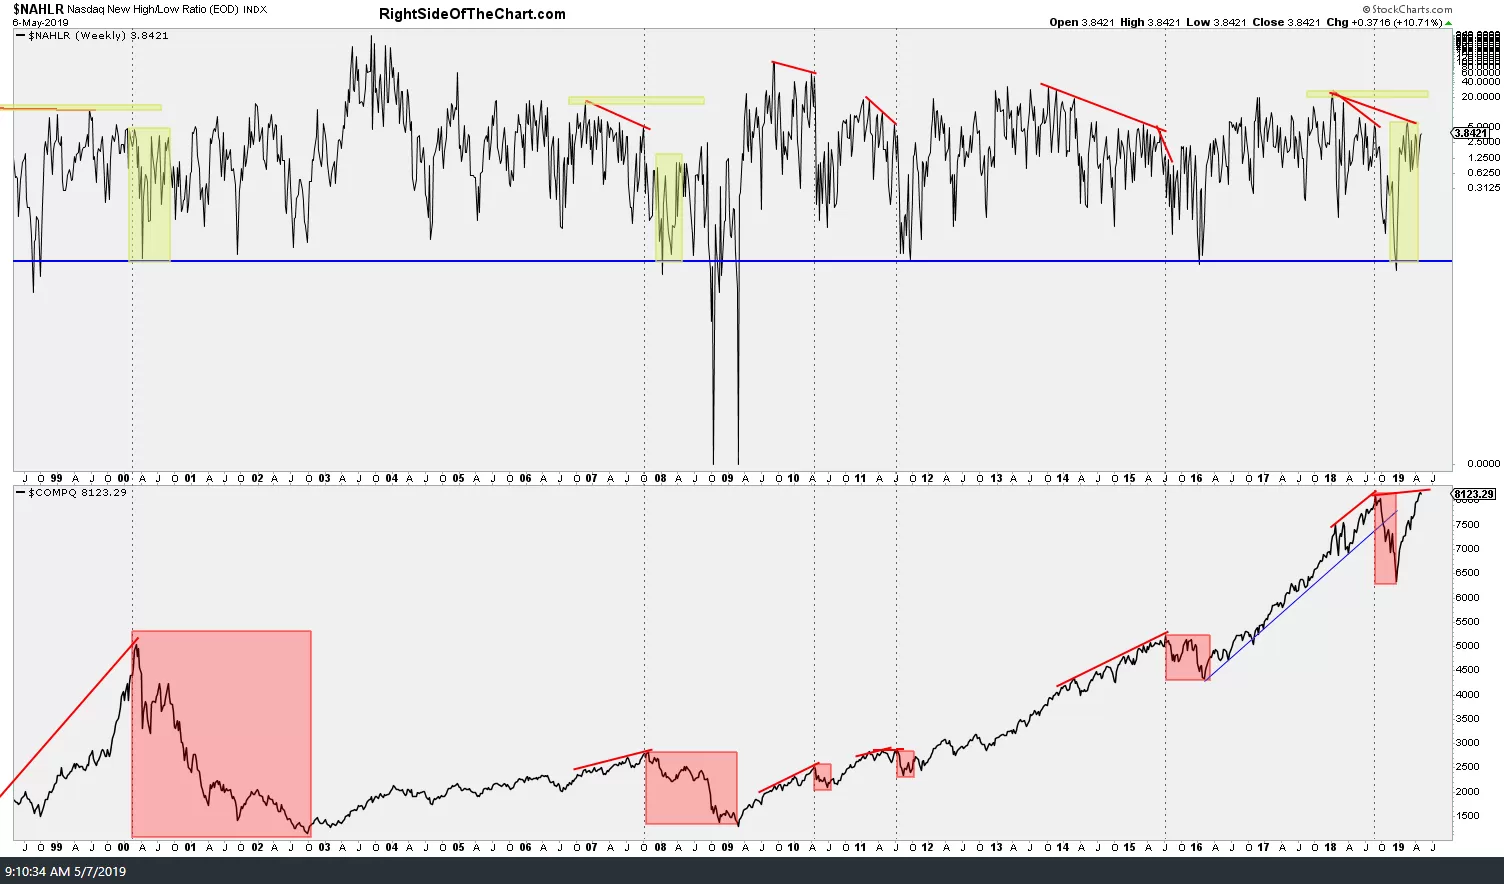
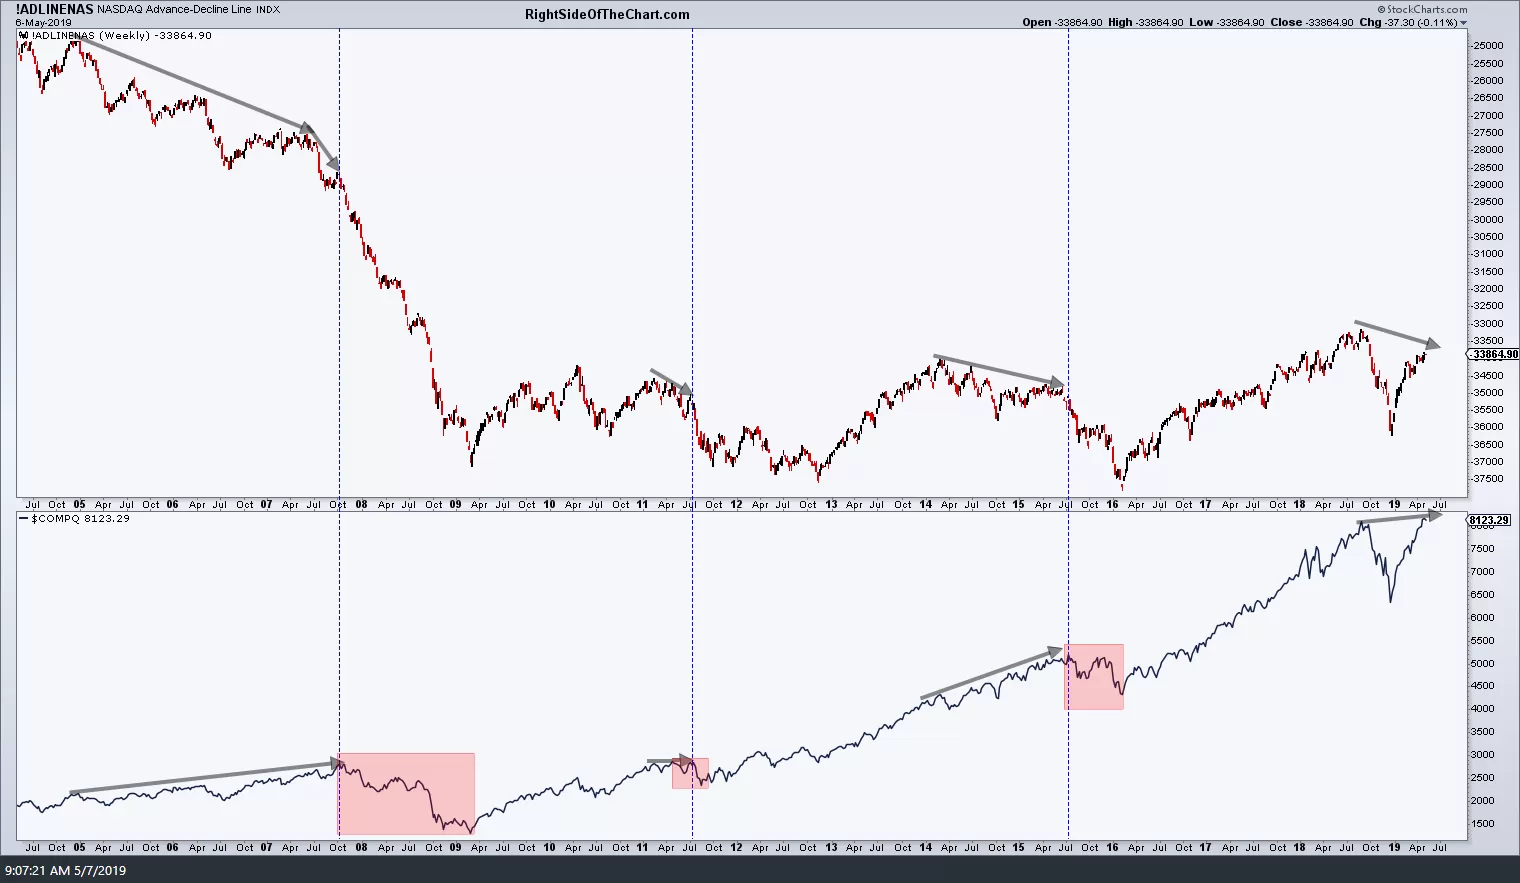
Next up we have the $NAHLR (Nasdaq New High/Low Ratio) as well as the !ADLINENAS (Nasdaq Advance-Decline Line) plotted against the $COMPQ also showing a clear historical pattern of divergences proceeding major corrections & bear markets while also highlighting the current divergences that were recently put in place when the Nasdaq broke out to a marginal new high.
-
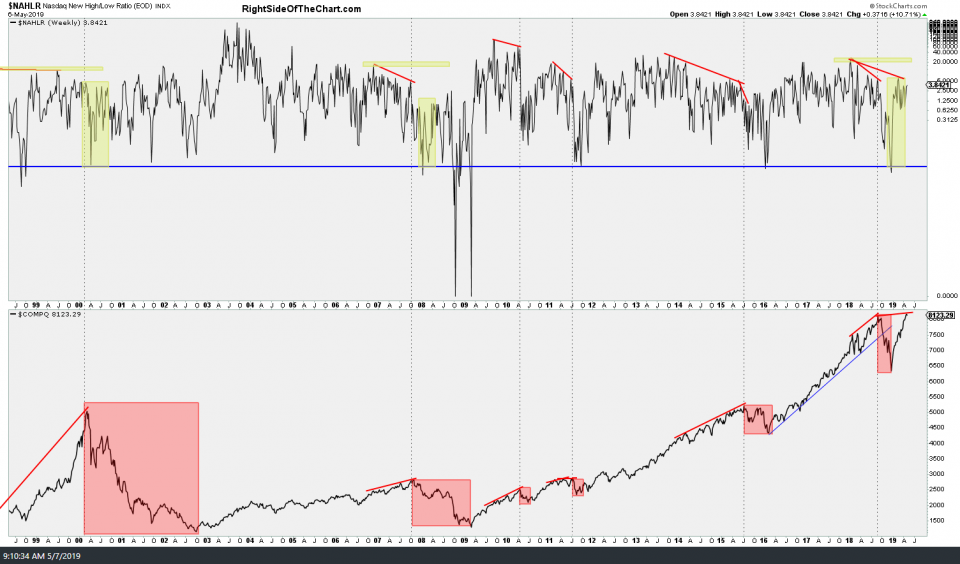
- NAHLR vs COMPQ May 7th
-
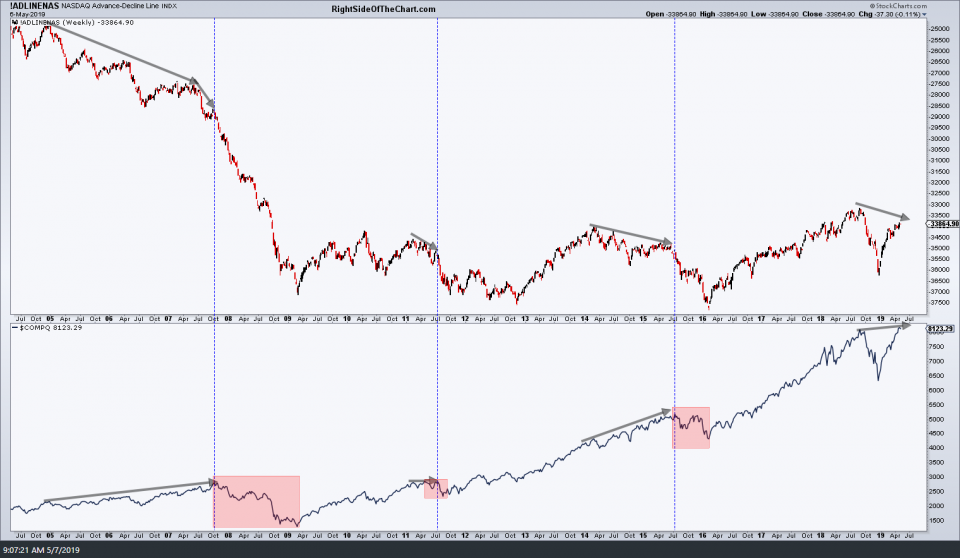
- ADLINENAS vs COMPQ May 7th
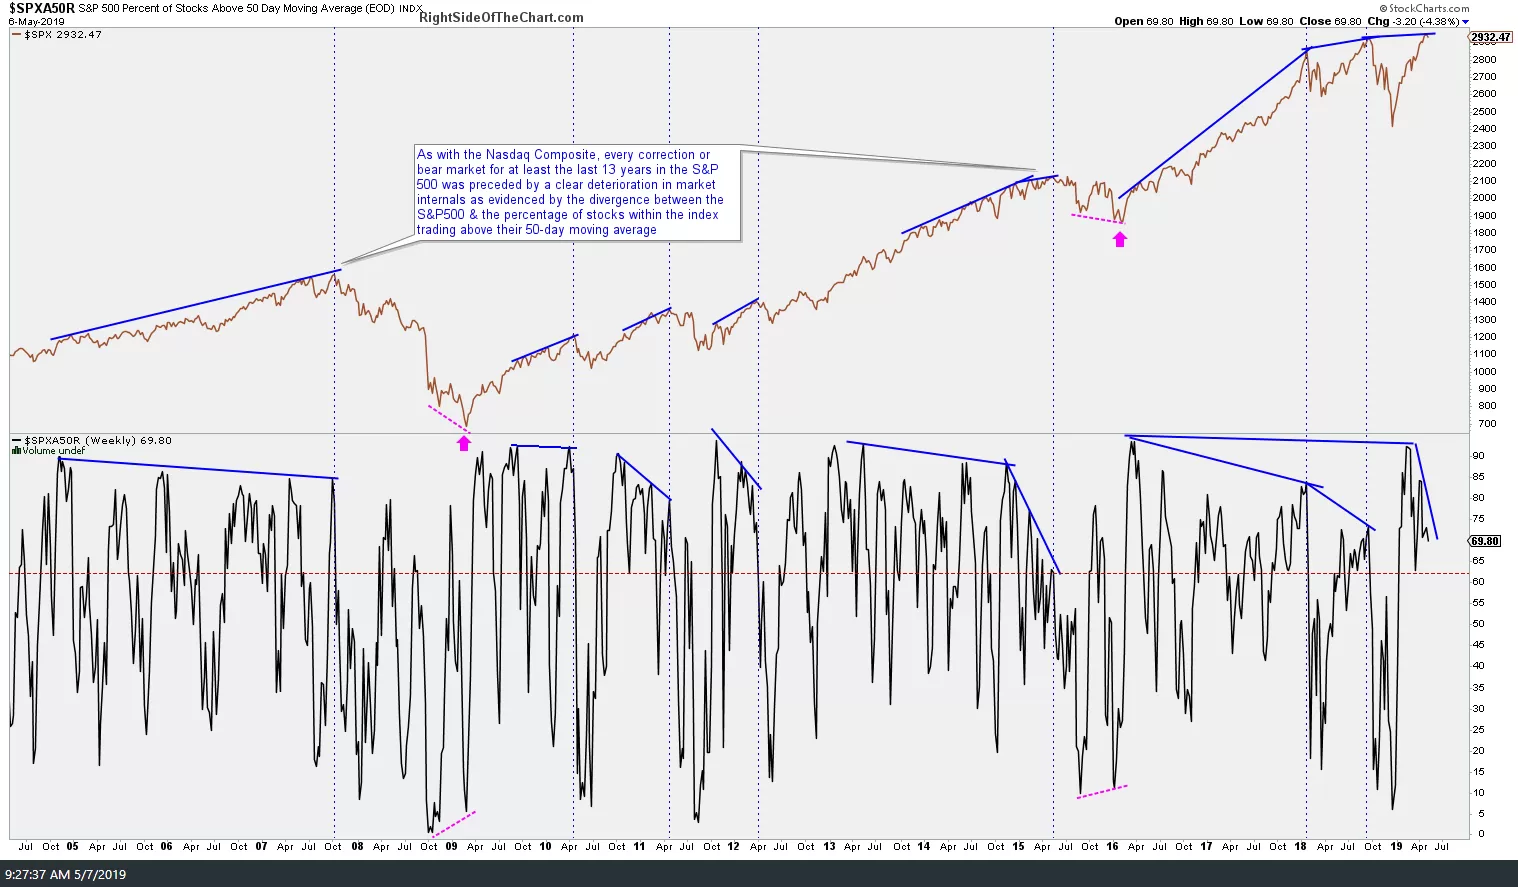
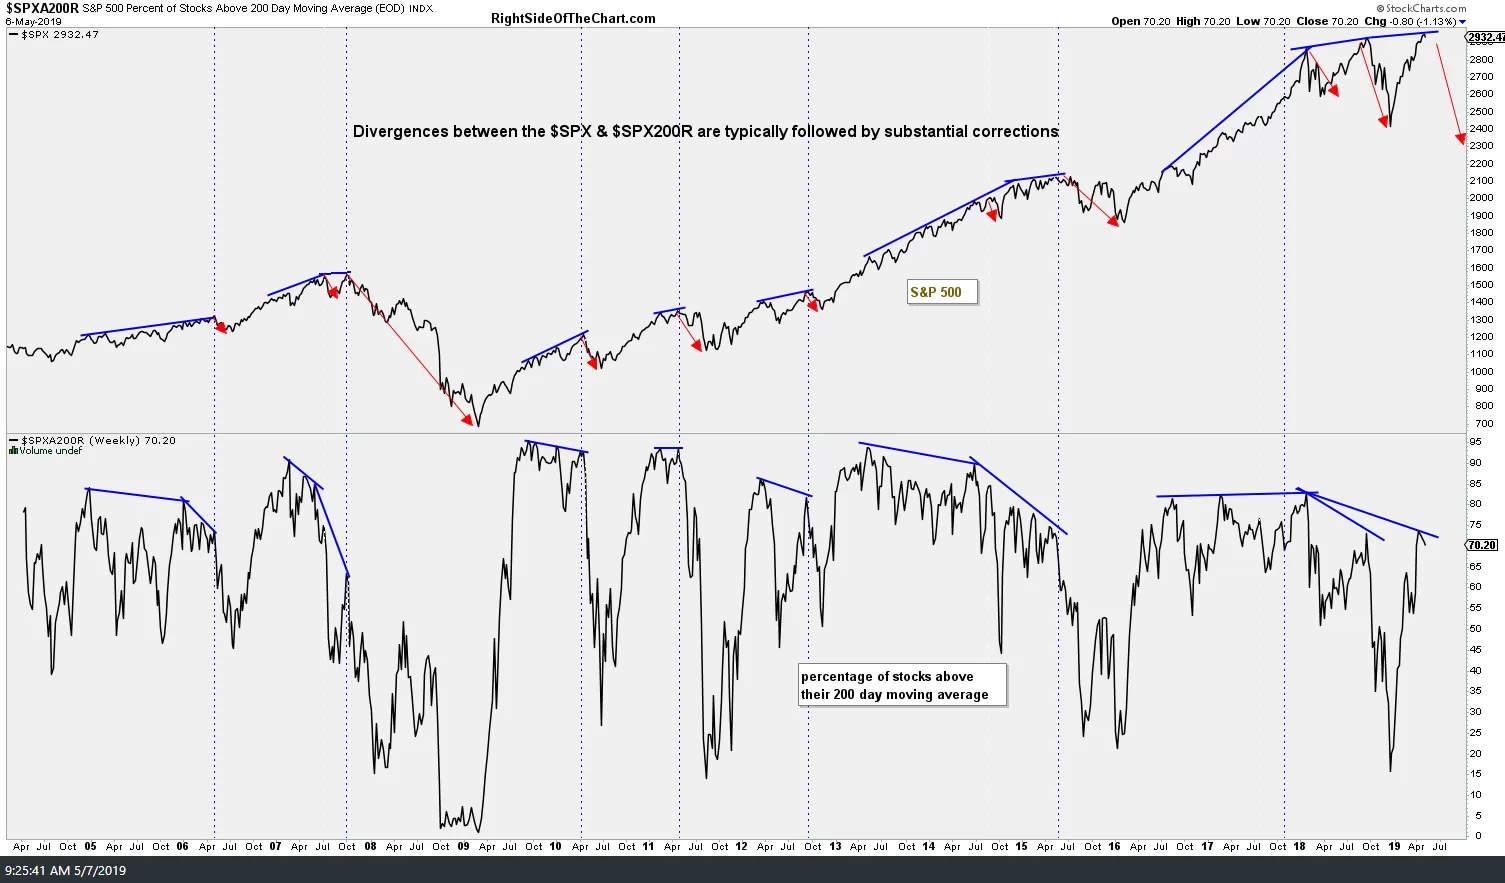
It isn’t just the tech-heavy market leading Nasdaq that is flashing warning signs with deteriorating breadth on the 2019 rally as similar red flags are in place on the broad market (S&P 500), such as the divergences between the percentage of stocks trading above their 50 & 200-day moving averages and the $SPX.
-
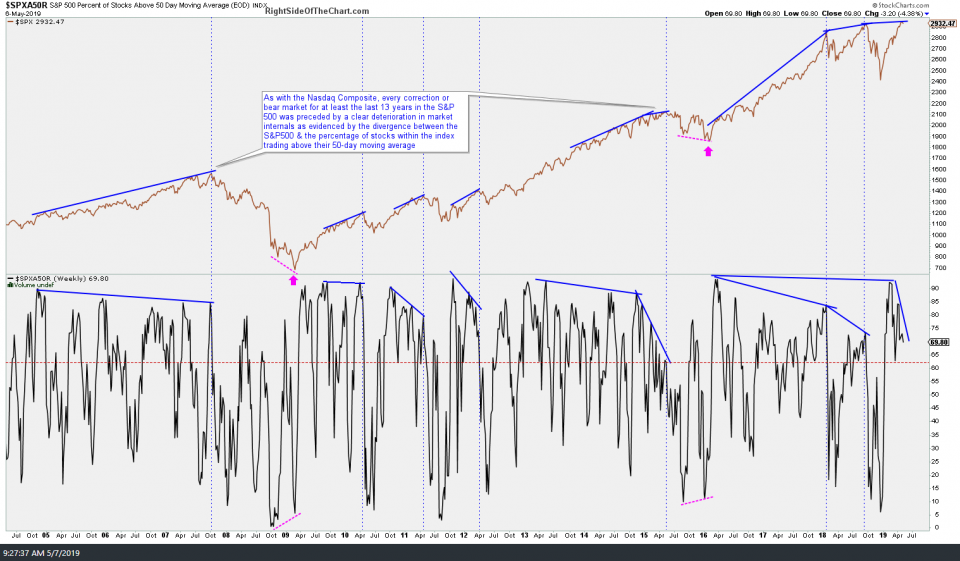
- SPXA50R May 7th
-
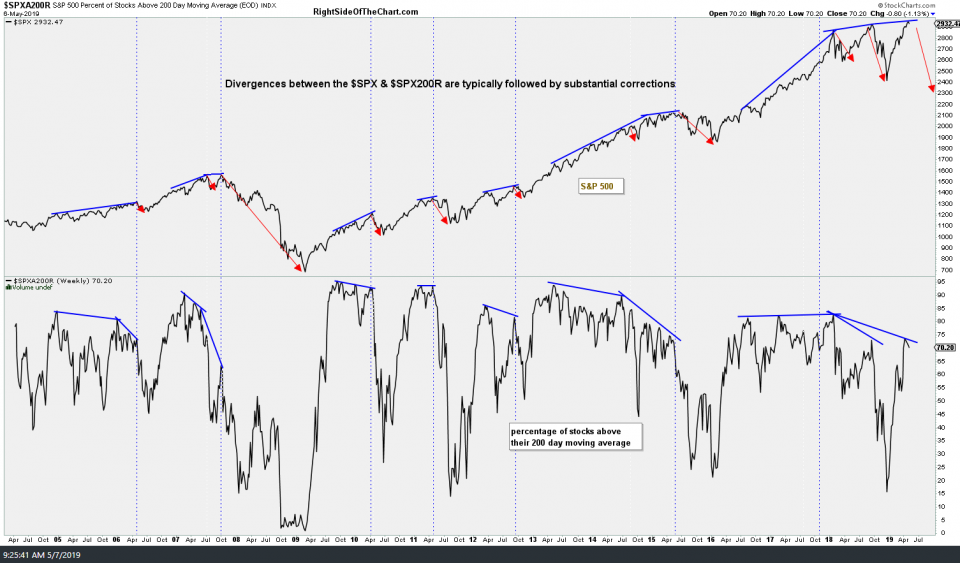
- SPXA200R May 7th
Bottom line: While divergences are not buy or sell signals, they are very useful in helping to identify when an existing trend is likely coming to an end & more importantly, those divergences can be very useful in helping to determine the scope & magnitude of the next trend. The divergences highlighted above, coupled with the recent sell signals on the stock market that were highlighted over the past week or so, may be useful in determining when & where to book profits on any existing & new short positions that might be taken soon, should the bearish case continue to firm up. Likewise, should the market break out to new highs & beyond soon, we will continue to monitor these divergences as long as they continue to build while we patiently await the next sell signal.