Analysis of various breadth indicators on the major stock indices and the implications they may have on the intermediate outlook for the US stock market (video) with the charts from that video posted below.
playback speed can be increased in the settings to reduce video duration
Desktop/laptop: Click on the first or any chart below to expand to full size. Once expanded, the charts can be panned & zoomed. Click on anywhere on the right of each expanded chart to advance to the next full size chart. Mobile: Pinch-zoom to expand, drag to pan.
-

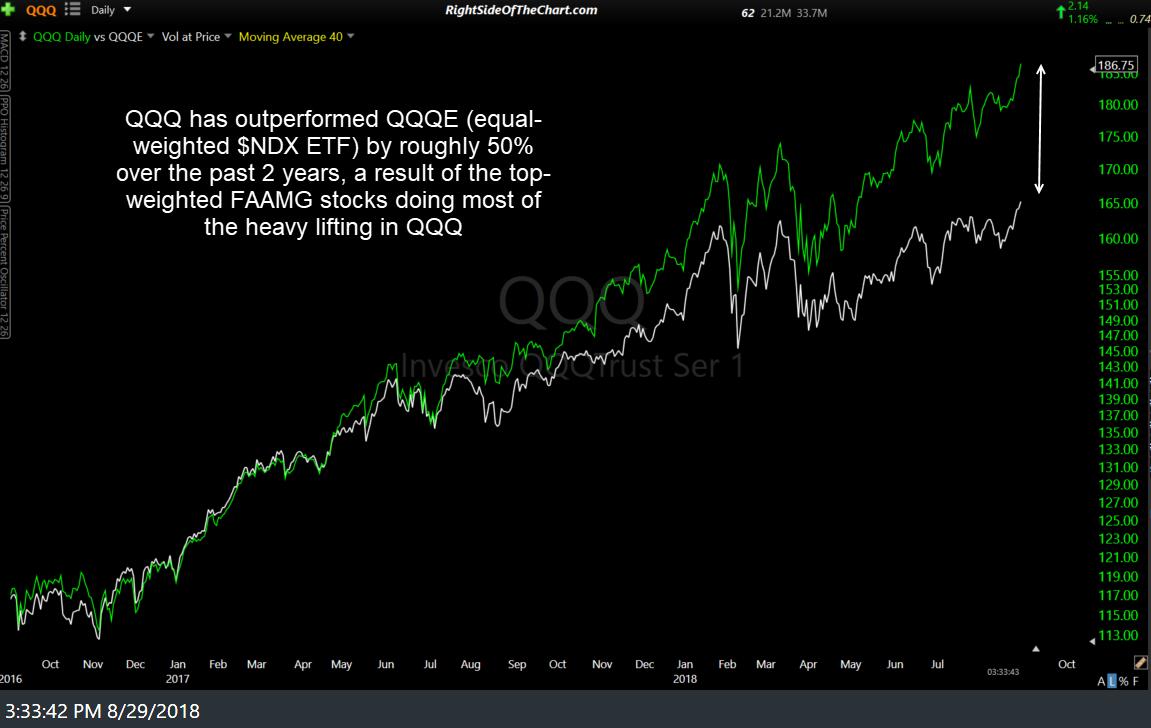
- QQQ vs QQQE 2-year Aug 29th
-

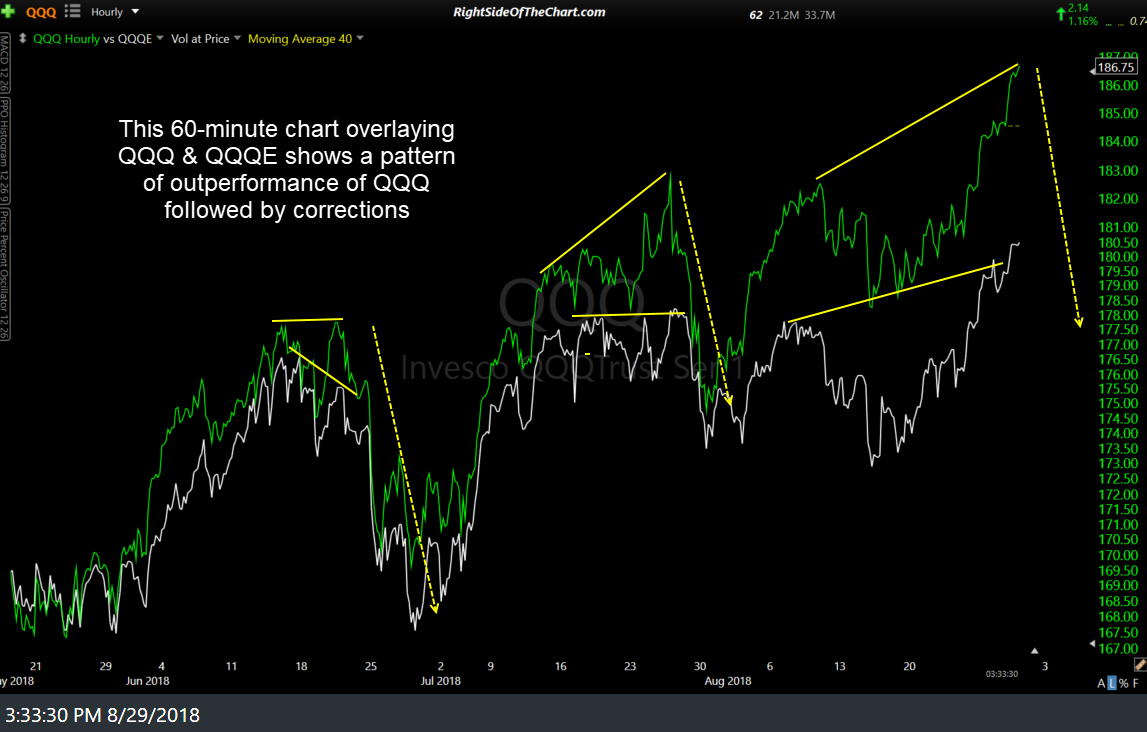
- QQQ vs QQQE 60-min Aug 29th
-

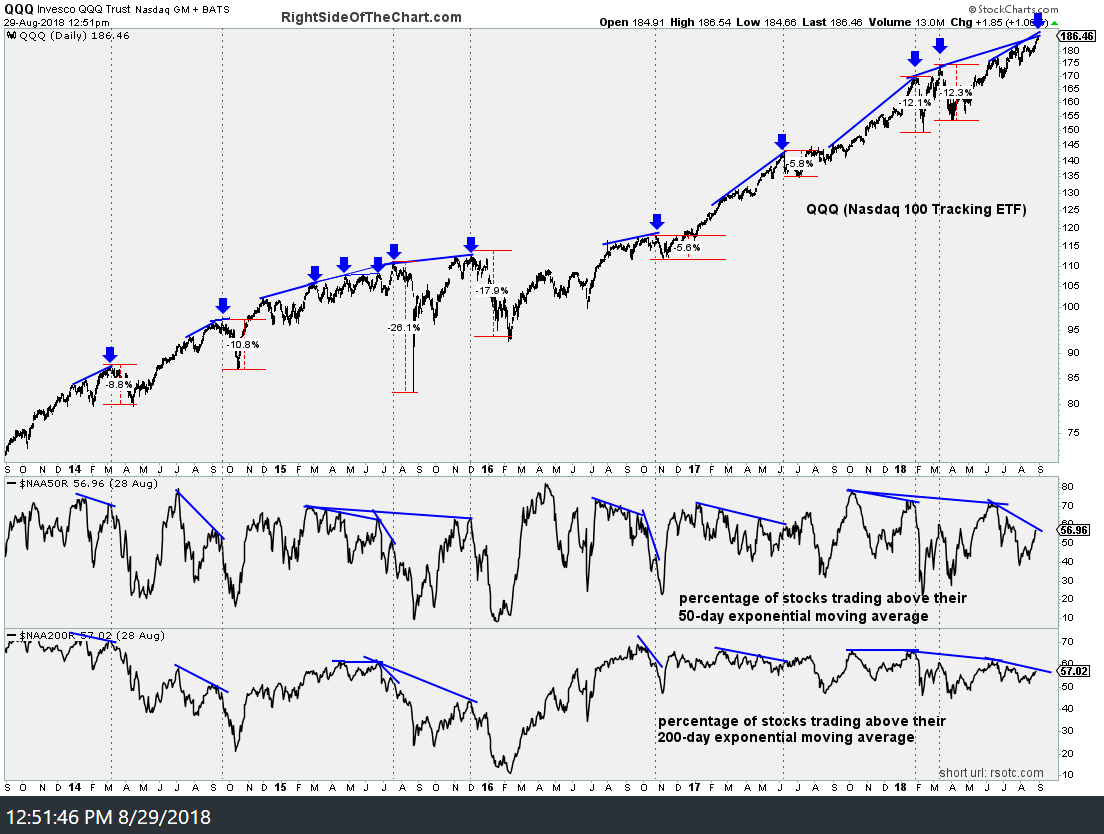
- QQQ NAA50R NAA200R Aug 29th
-

- $NAA200R vs COMPQ Aug 29th

-

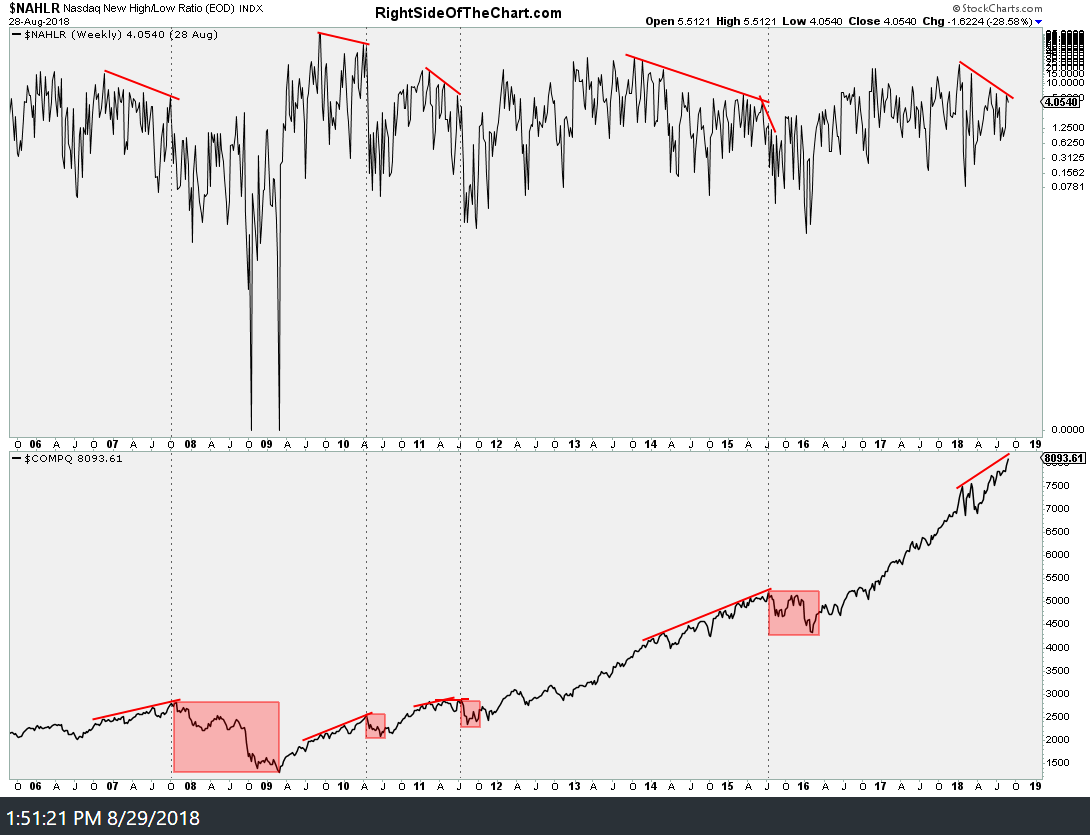
- $NAHLR vs COMPQ Aug 29th
-

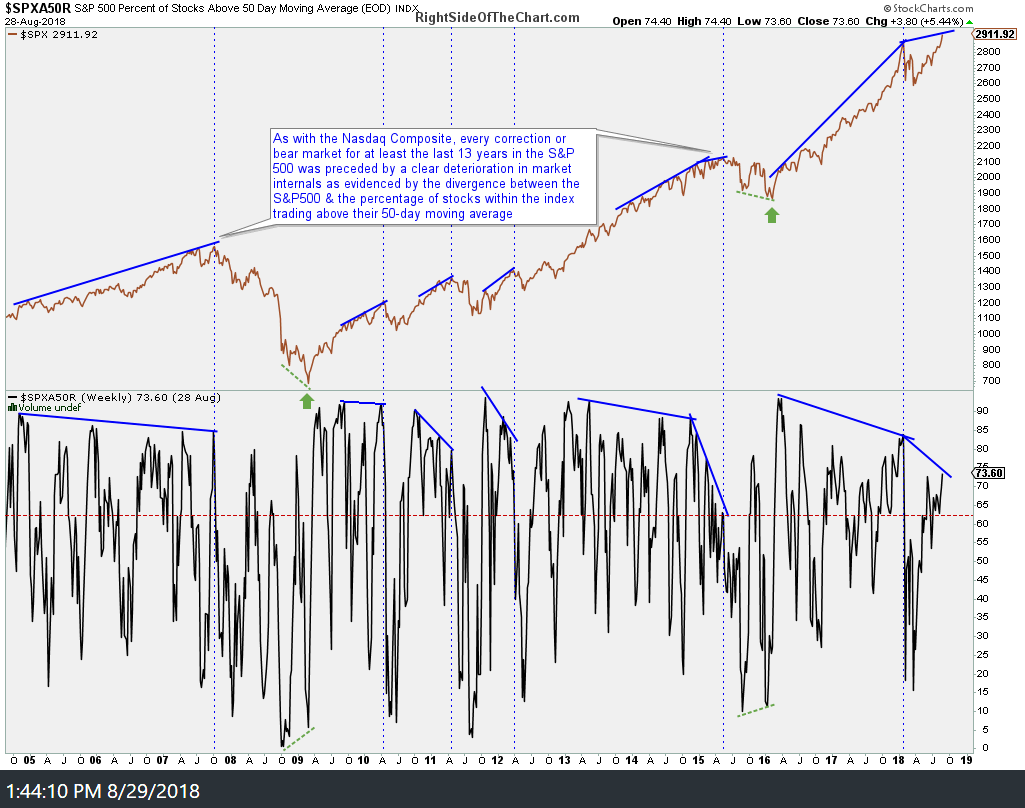
- SPXA50R vs SPX Aug 29th
-

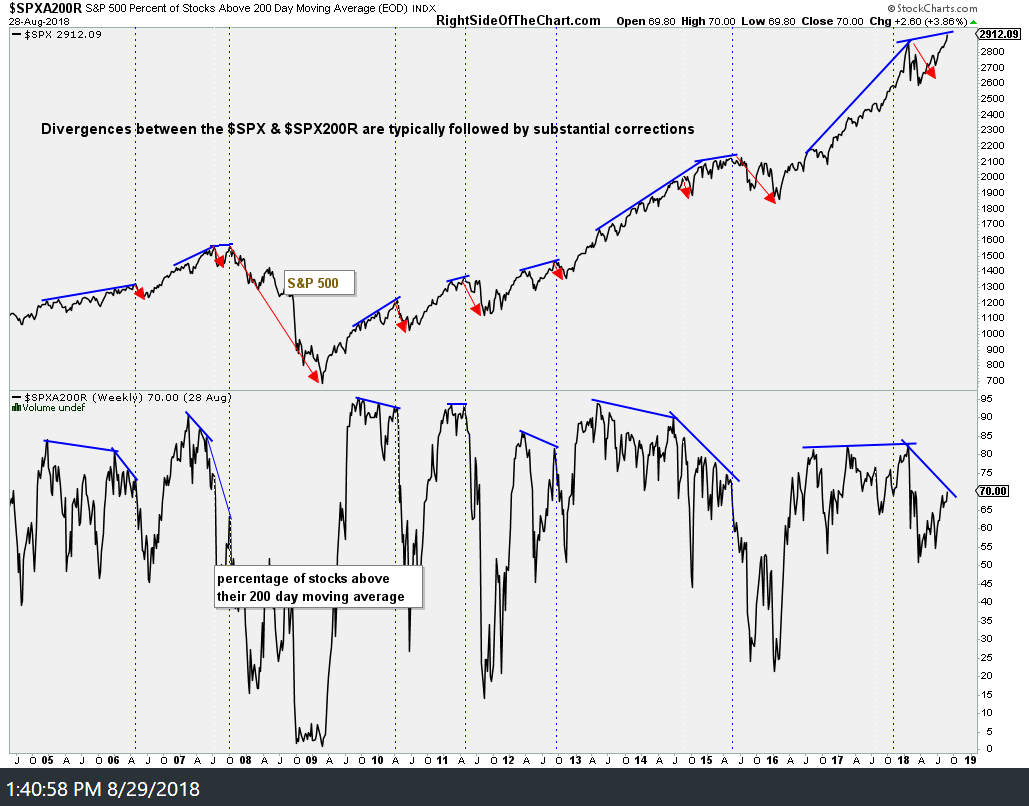
- SPXA200R vs SPX Aug 29th
-

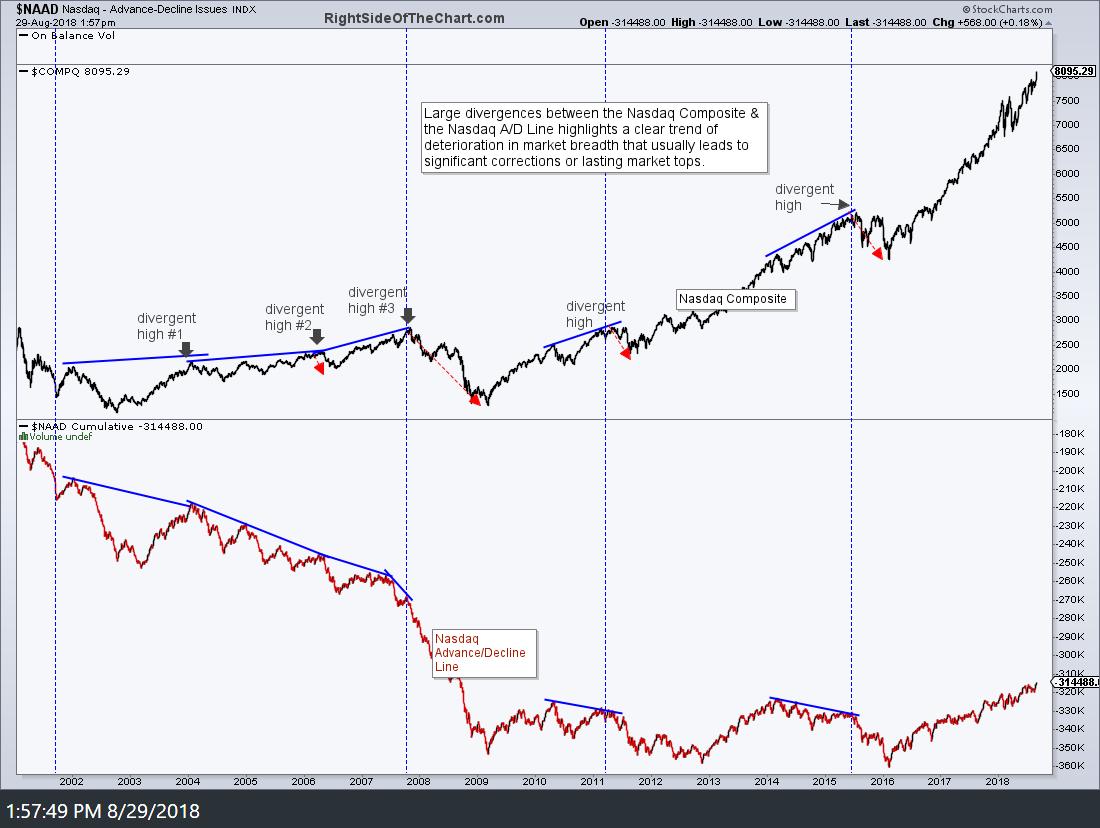
- NAAD vs COMPQ Aug 29th
-

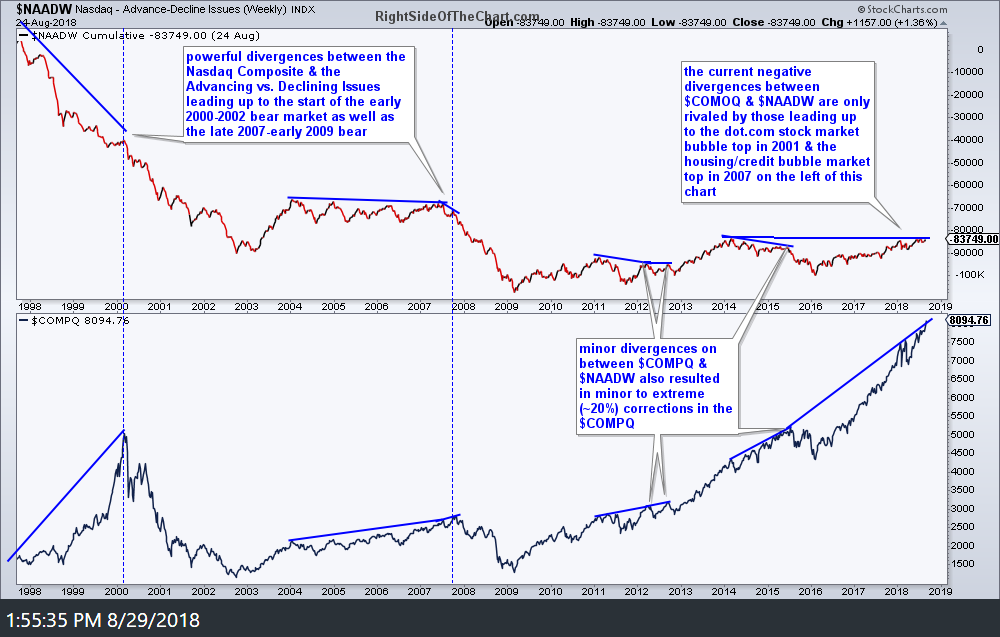
- NAADW vs COMPQ Aug 29th