
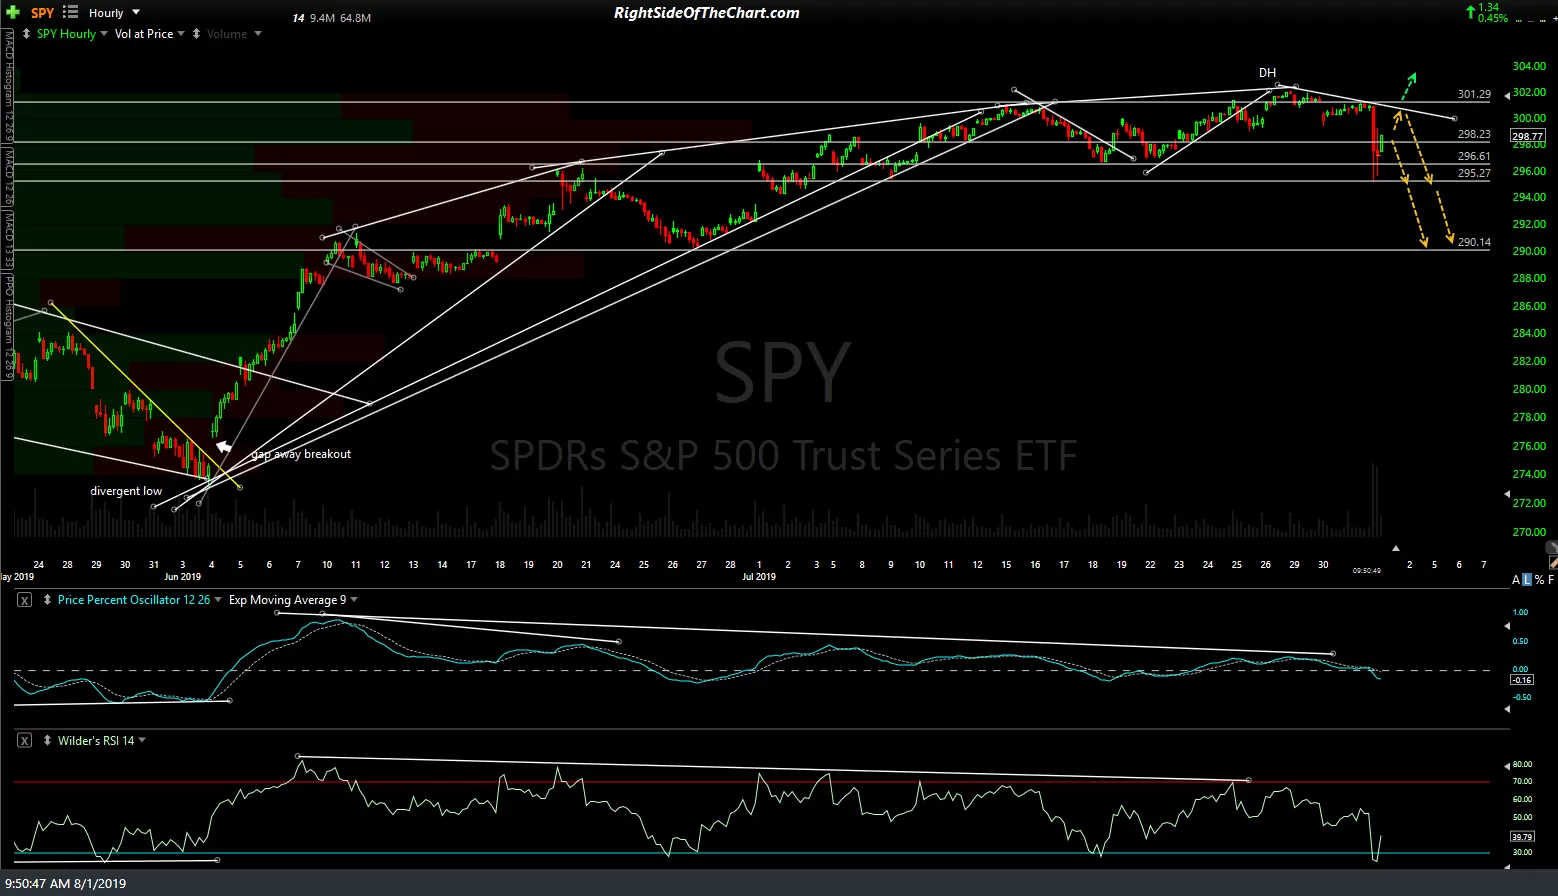
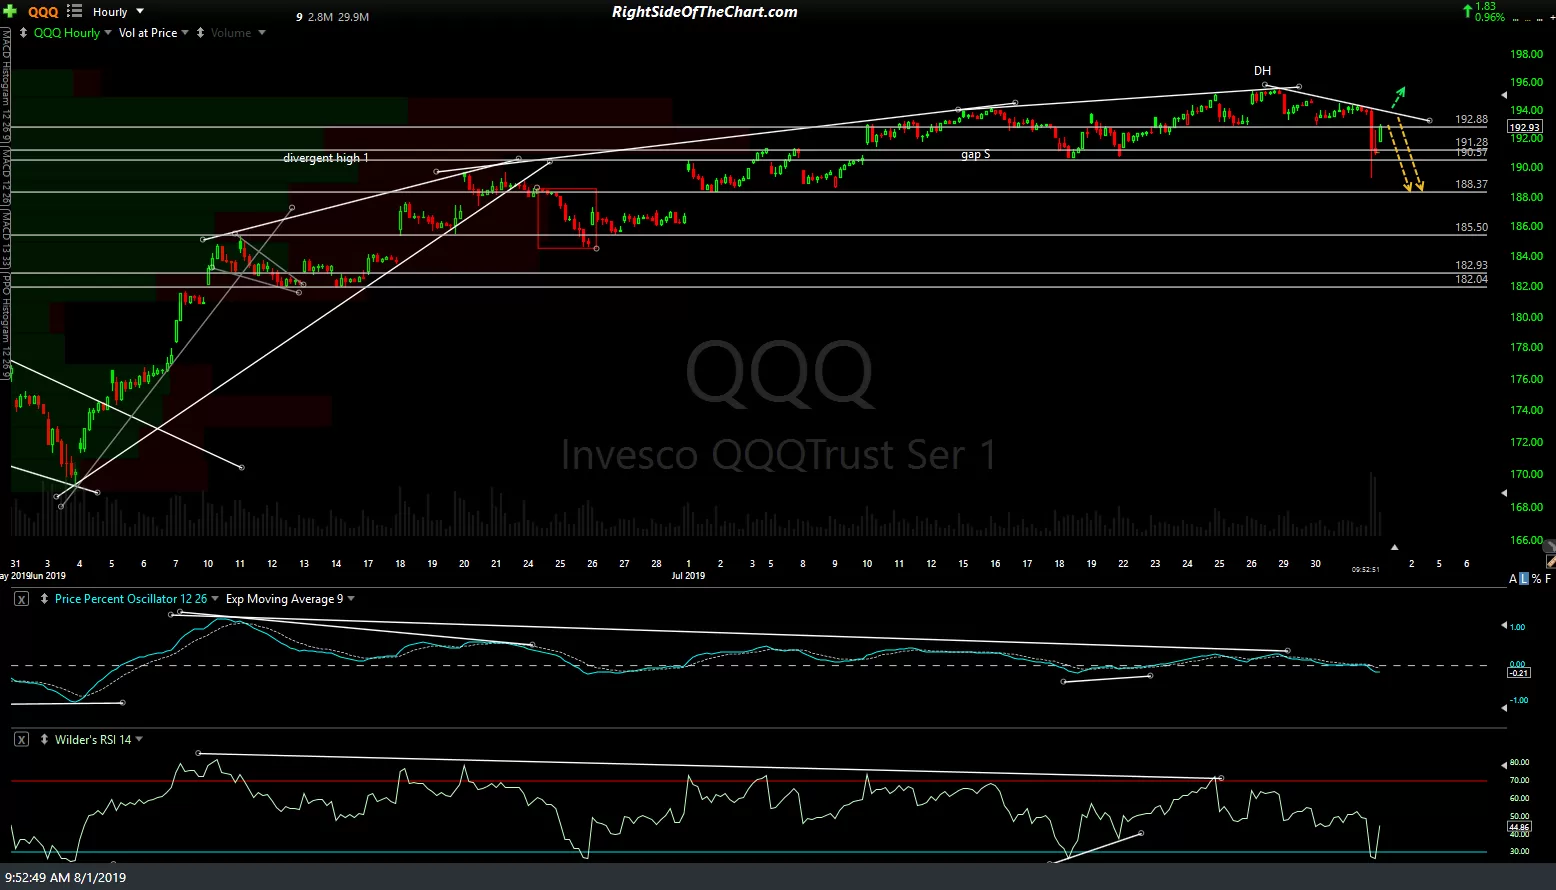
The 60-minute charts below list some nearby support & resistance levels on the major large-cap index ETF (SPY & QQQ) and futures (/ES & /NQ). These levels could be used in several ways; Those bullish could look to go long on pullbacks to support or breakouts above resistance while those bearish could short breaks of support and/or bounces into resistance. For example, I posted this 60-minute chart of /NQ in the trading room a few minutes ago stating an “Objective short entry on /NQ on this bounce back to the 7920 R level with a stop somewhat above the downtrend line (60-min close)”. That could be a short entry for a quick ‘pullback-off-resistance” day trade or a partial or full entry for a potential swing trade, depending on one’s outlook & expectation for the market.
-
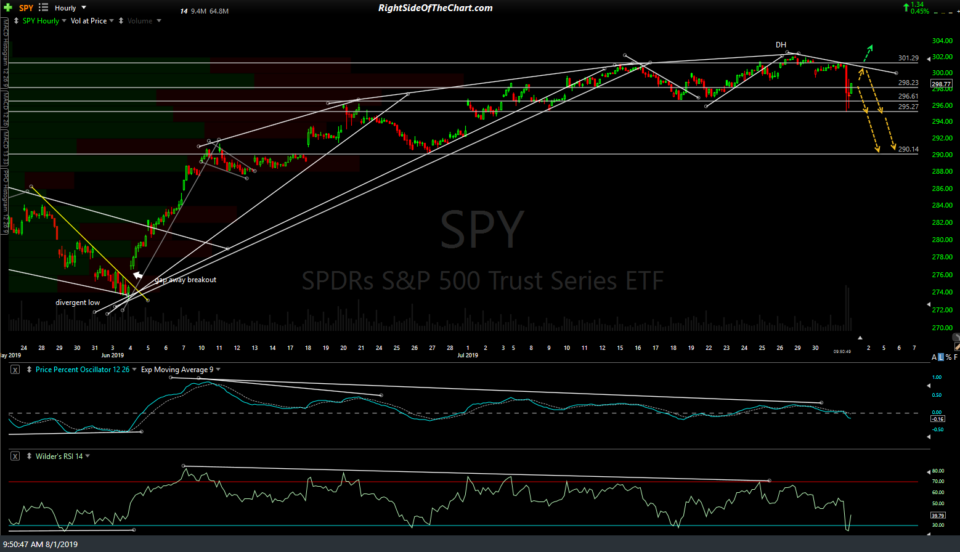
- SPY 60-min Aug 1st
-
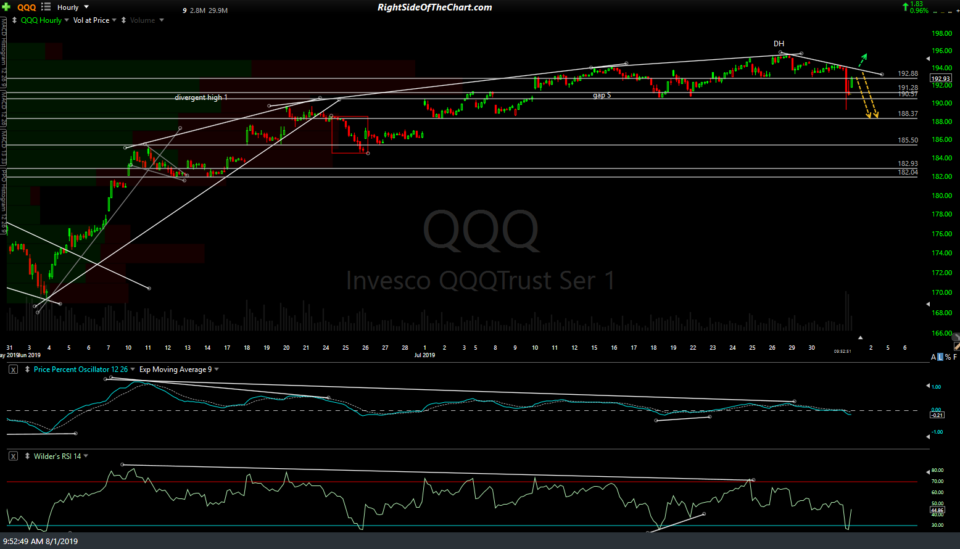
- QQQ 60-min Aug 1st
-

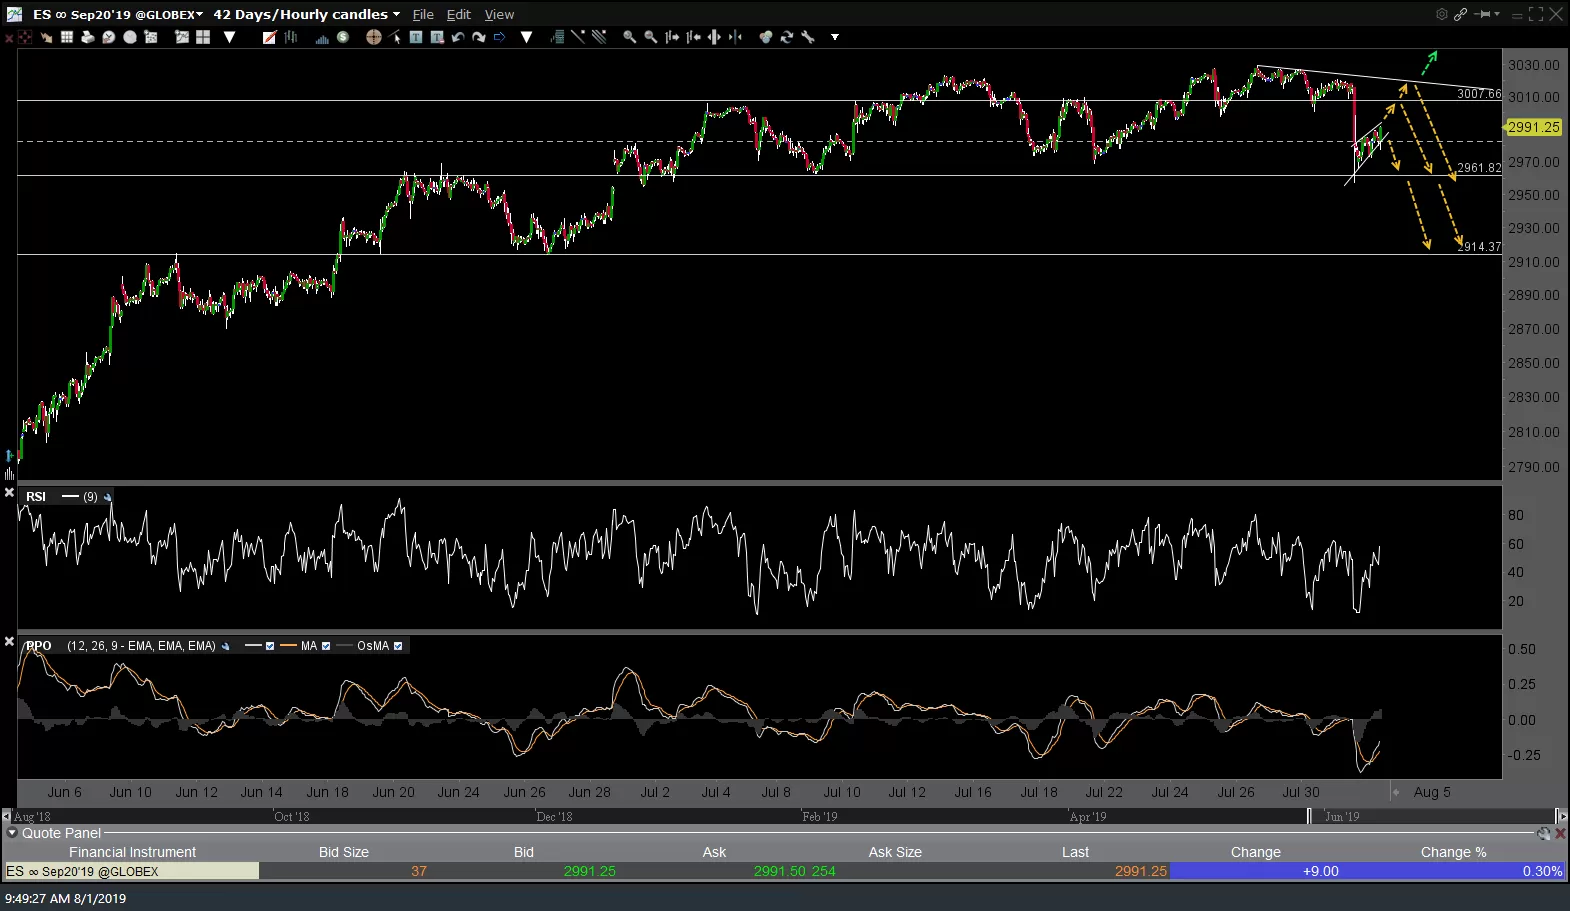
- ES 60-min Aug 1st
-
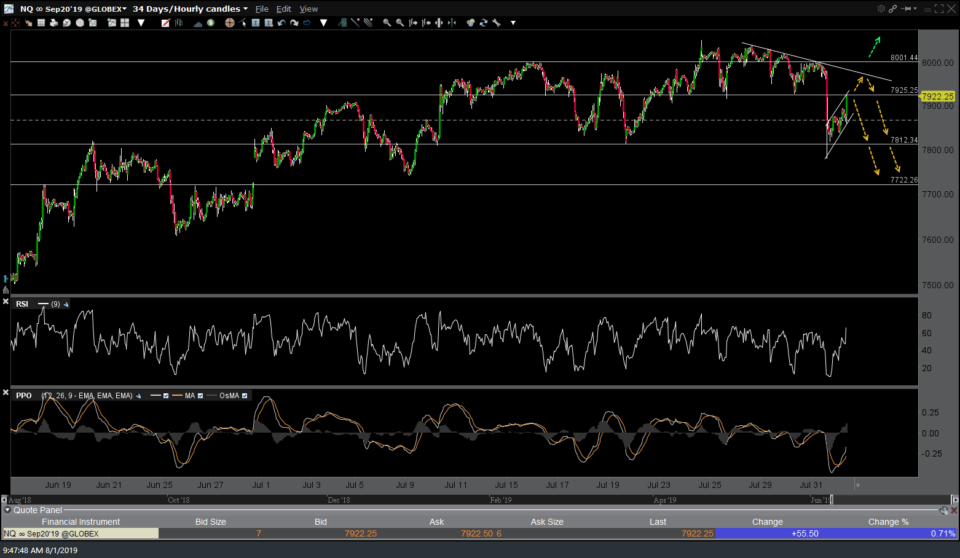
- NQ 60-min 2 Aug 1st

As stated in yesterday’s final end-of-session video, both SPY & QQQ remain above their recent breakouts above the previous all-time highs from late April, which remain key technical/support levels. As such, until & unless both SPY & QQQ clearly move back down below those levels, we don’t have any high-probability sell signals in which to consider an official short swing trade on the equity indices. Also as mentioned in yesterday’s videos, while yesterday’s breakdowns in SPY, QQQ, XLK & others were certainly impulsive & solid, they have to be taken with a grain of salt as they were the result of the post-FOMC “noise” which always runs a considerably higher rate of proving to be a false or whipsaw signal vs. breakdowns that occur on non-Fed days.
My own preference is to maintain a partial short position on the market (via /NQ & QQQ-related ETFs) while watching the price action in the coming sessions as the post-FOMC “noise” begins to abate and the next direction in the market starts to become more clear. Active traders might be able to take advantage of the post-FOMC spike in volatility by actively day trading off the intraday charts today & possibly tomorrow while typical swing traders & investors might be best keeping things light until the next direction in the market starts to become clear (e.g.- solid & impulsive breaks below the key support levels below or above the overhead resistance levels). I will also continue to focus my swing trading on individual stocks, sectors & commodities with the most attractive R/R profiles & clearly bullish or bearish technicals.